Salesforce Revenue Reporting System
Automated ETL, historical pipeline snapshots and executive dashboards
Replaced hours of manual CRM analysis with an automated reporting pipeline that generated weekly pipeline reports and forecast validation from Salesforce data.
- Problem
- Weekly pipeline reporting depended on hours of manual Salesforce exports and comparison, with no reliable view of what changed and why.
- What I Built
- An automated ETL pipeline that snapshots Salesforce data weekly and compares it against prior periods to classify movement.
- Impact
- Replaced hours of manual CRM analysis per week with automated reporting across thousands of opportunities and 5 movement categories.
- Stack
- SalesforcePower QueryVBAExcel
Project Summary
- Sector
- Sales Operations & Revenue Analytics
- Engagement
- Internal decision-support and reporting system, built and maintained during an ongoing client engagement
- Tools
- Salesforce (source), Power Query (M), VBA, Excel
- My role
- Designed and implemented the complete reporting workflow: data extraction, historical snapshot architecture, automated comparison logic, reporting outputs, and downstream analytical datasets
- Input
- Salesforce Opportunity export (Power Query)
- Output
- Weekly movement report, historical snapshot archive
6
Pipeline stages
5
Movement categories
New, lost, changed, open, no change
Weekly
Refresh cadence
250–300
Rows per snapshot
Synthetic sample size
The sample data on this page is synthetic: fictional names, randomized amounts, and a reduced record count (roughly 250–300 rows per snapshot, instead of the several thousand reviewed weekly in production). It's built to demonstrate the same mechanics at a size a visitor can actually read through.
Input
Output
Decision Context
The client runs its sales pipeline through Salesforce.
Every week, before the sales review, leadership needed answers to three questions: what's new since last week, what's been lost or postponed, and what changed on deals still in play. The same weekly pull anchors a second, slower-moving decision: whether the forecast assumptions used for revenue planning are holding up, by checking what a prior week expected to close against what the pipeline shows today.
Timing matters here because the review is weekly and recurring. A one-off analysis doesn't help if it can't be refreshed with the same effort every week. And because the volume is large enough (thousands of open and closed opportunities), a person scanning Salesforce by eye will miss things, particularly the deals that quietly changed stage or value without closing.
The Problem
Before this pipeline existed, getting a reliable week-over-week view of the Salesforce pipeline meant a choice between two flawed options.
Existing situation
Required outcome
Manually pulling and reviewing the full opportunity list every week.
One-click extraction and snapshot, refreshed on demand.
Salesforce's native reporting shows a point-in-time state with no historical comparison.
A continuously growing historical snapshot archive.
A single missed row is invisible at this volume.
Automated comparison flags every meaningful movement.
Without a controlled comparison, the alternative is a sales meeting that runs on whatever a person remembers changed, or a stale export that nobody has time to re-check line by line.
Solution Architecture
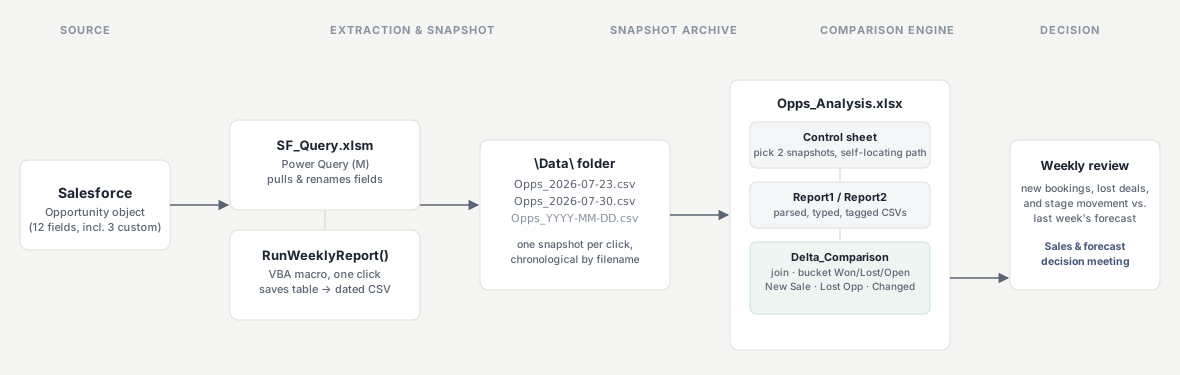
Rather than replacing Salesforce, the solution extended it with a lightweight analytical layer.
01
Extract
Power Query connects to Salesforce and pulls the current Opportunity data on demand.
02
Snapshot
A one-click VBA macro copies the extracted table to an immutable, dated CSV before refreshing the connection, so each file preserves exactly what was on screen at the moment of the click.
03
Archive
Every weekly CSV lands in a structured, monitored snapshot folder, building a continuously growing historical dataset of the pipeline.
04
Compare
The Control sheet lets someone pick any two reporting periods; the comparison engine joins them on Opportunity ID.
05
Classify
Every meaningful pipeline movement, new, lost, changed, or still open, is bucketed and labeled.
06
Report
The classified output feeds standardized weekly management reporting for the sales and forecast meeting.
Because every reporting cycle became part of a continuously growing historical dataset, the extracted information could later be reused by additional reporting processes, forecasting models, and operational dashboards without requiring new data extraction. The reporting interface was only one consumer of the dataset.
Data Extraction & Snapshot Architecture
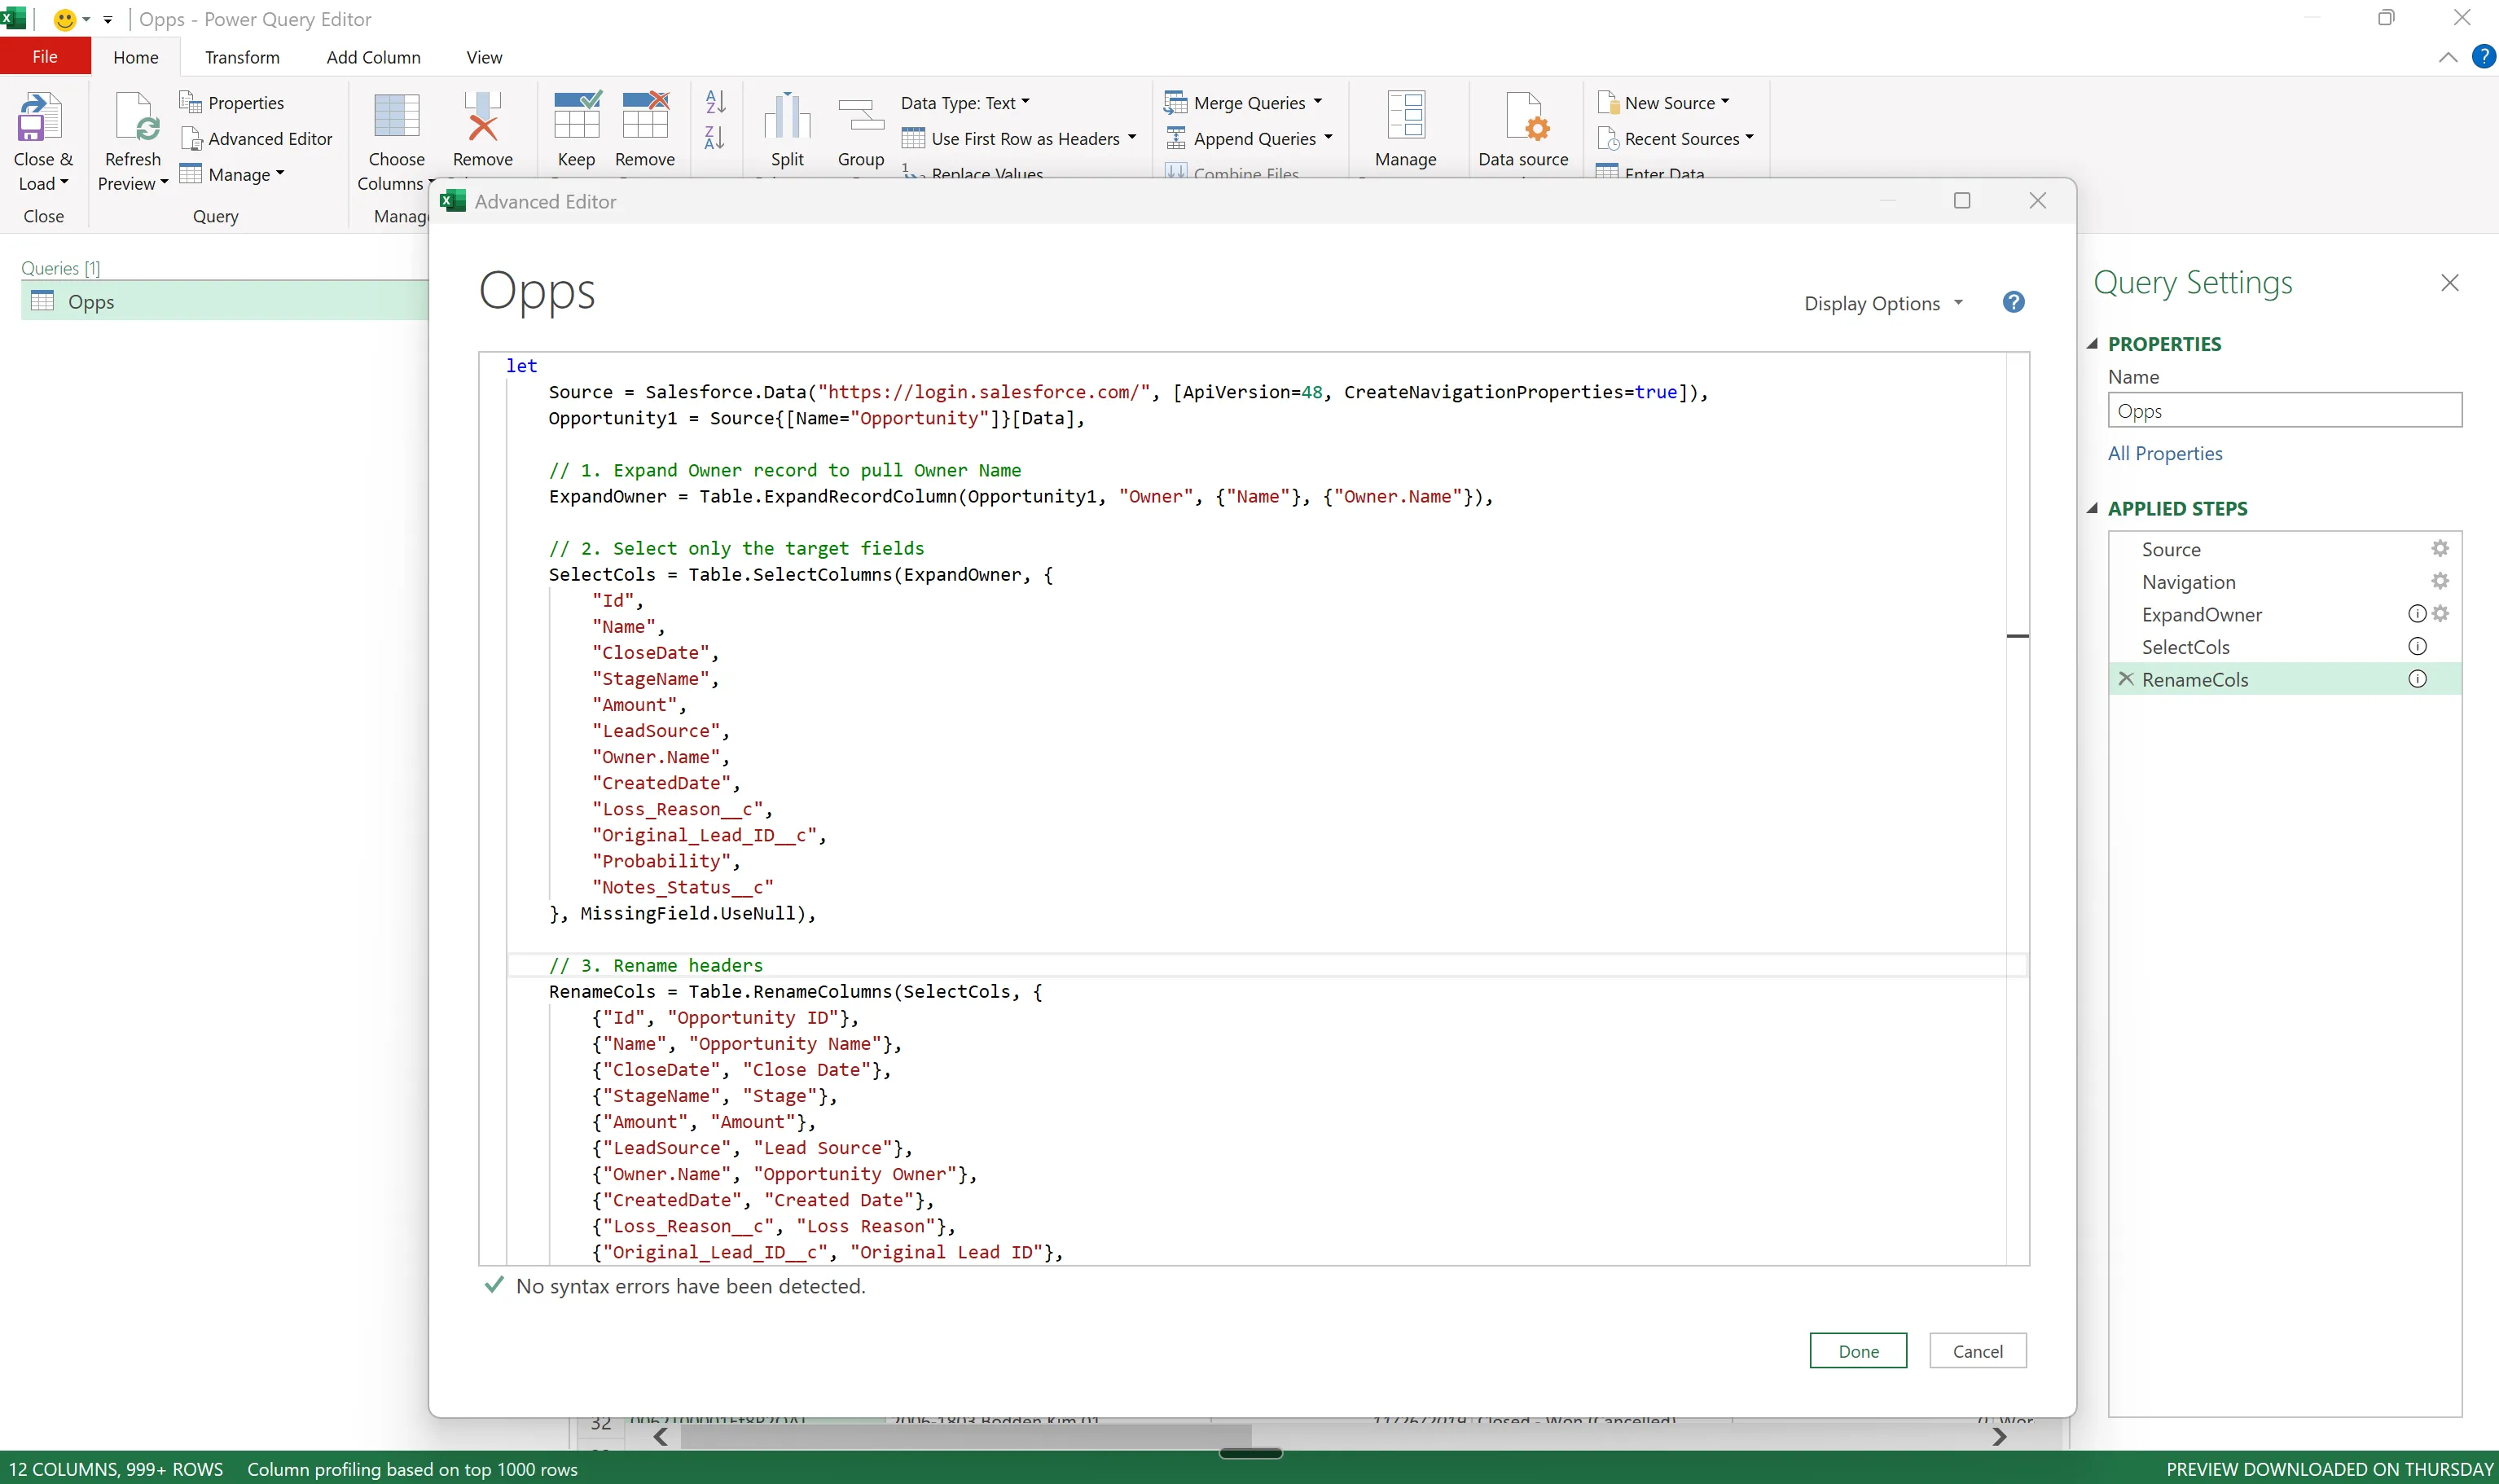
The first file, SF_Query.xlsm, is the extraction and snapshot step: one Power Query connection pulls the live Opportunity data from Salesforce, and one button turns whatever is on screen into a dated CSV snapshot.
Opps sheet: the live Salesforce pull
The workbook's single query, Opps, connects to Salesforce directly and loads straight to a worksheet table. It pulls twelve fields, including three custom fields, and flattens the Owner lookup into a plain name column. There's no refresh-on-open flag, so the table only updates when a person, or the macro, triggers it.
- File
- SF_Query.xlsm
- Sheet
- Opps (loaded query table)
- Fields
- 12, incl. 3 custom
Save Opps as CSV: the snapshot button
A Forms-toolbar button on the Opps sheet, captioned "Save Opps as CSV," runs a single macro: it builds a dated filename, copies the live table into a new standalone workbook, saves that copy as a UTF-8 CSV, then refreshes the Salesforce connection so the sheet is current for next week's click. Nothing is scheduled and there's no open-triggered refresh; a person has to click the button.
- Trigger
- Forms button, "Save Opps as CSV"
- Filename pattern
- Opps_YYYY-MM-DD.csv
- Encoding
- UTF-8 (xlCSVUTF8)
Weekly Comparison Engine
The second file, Opps_Analysis.xlsx, is the comparison engine: it reads whichever two snapshot CSVs someone selects and produces the weekly movement view.
Control sheet: snapshot selection
The Control sheet is the only place a person interacts with directly. Its two dropdowns are constrained by a data-validation list sourced from a live query of the CSVs sitting in the snapshot folder, so someone can only select a file that actually exists, no typos, no picking a week that was never saved, and compare any two weeks without touching the query itself.
- Data folder
- C:\Users\[User]\Documents\SalesforceExtract\Data\
- Report 1 (current)
- Opps_2026-07-30_synthetic.csv
- Report 2 (prior)
- Opps_2026-07-23_synthetic.csv
Report1 / Report2: parsed weekly snapshots
Each snapshot is loaded, tagged with its own source filename so a person can immediately tell which week they're looking at.
| Opportunity Name | Stage | Amount | Lead Source | Owner |
|---|---|---|---|---|
| 2006-1500 Singh Elizabeth 04 | Closed - Won (Cancelled) | $21,176 | Media/Publication | John Spencer |
| 2207-1400 Giles Joshua 03 | Closed - Won | $114,600 | Media/Publication | Yolanda Mack |
| 2009 Duncan David 02 | Postponed for Future | $59,640 | Website - Google | Dana Garza MD |
| 1912 Bates Brian 03 | Closed - Lost | $42,207 | Website - Google | Yolanda Mack |
WoW_Comparison: weekly movement output
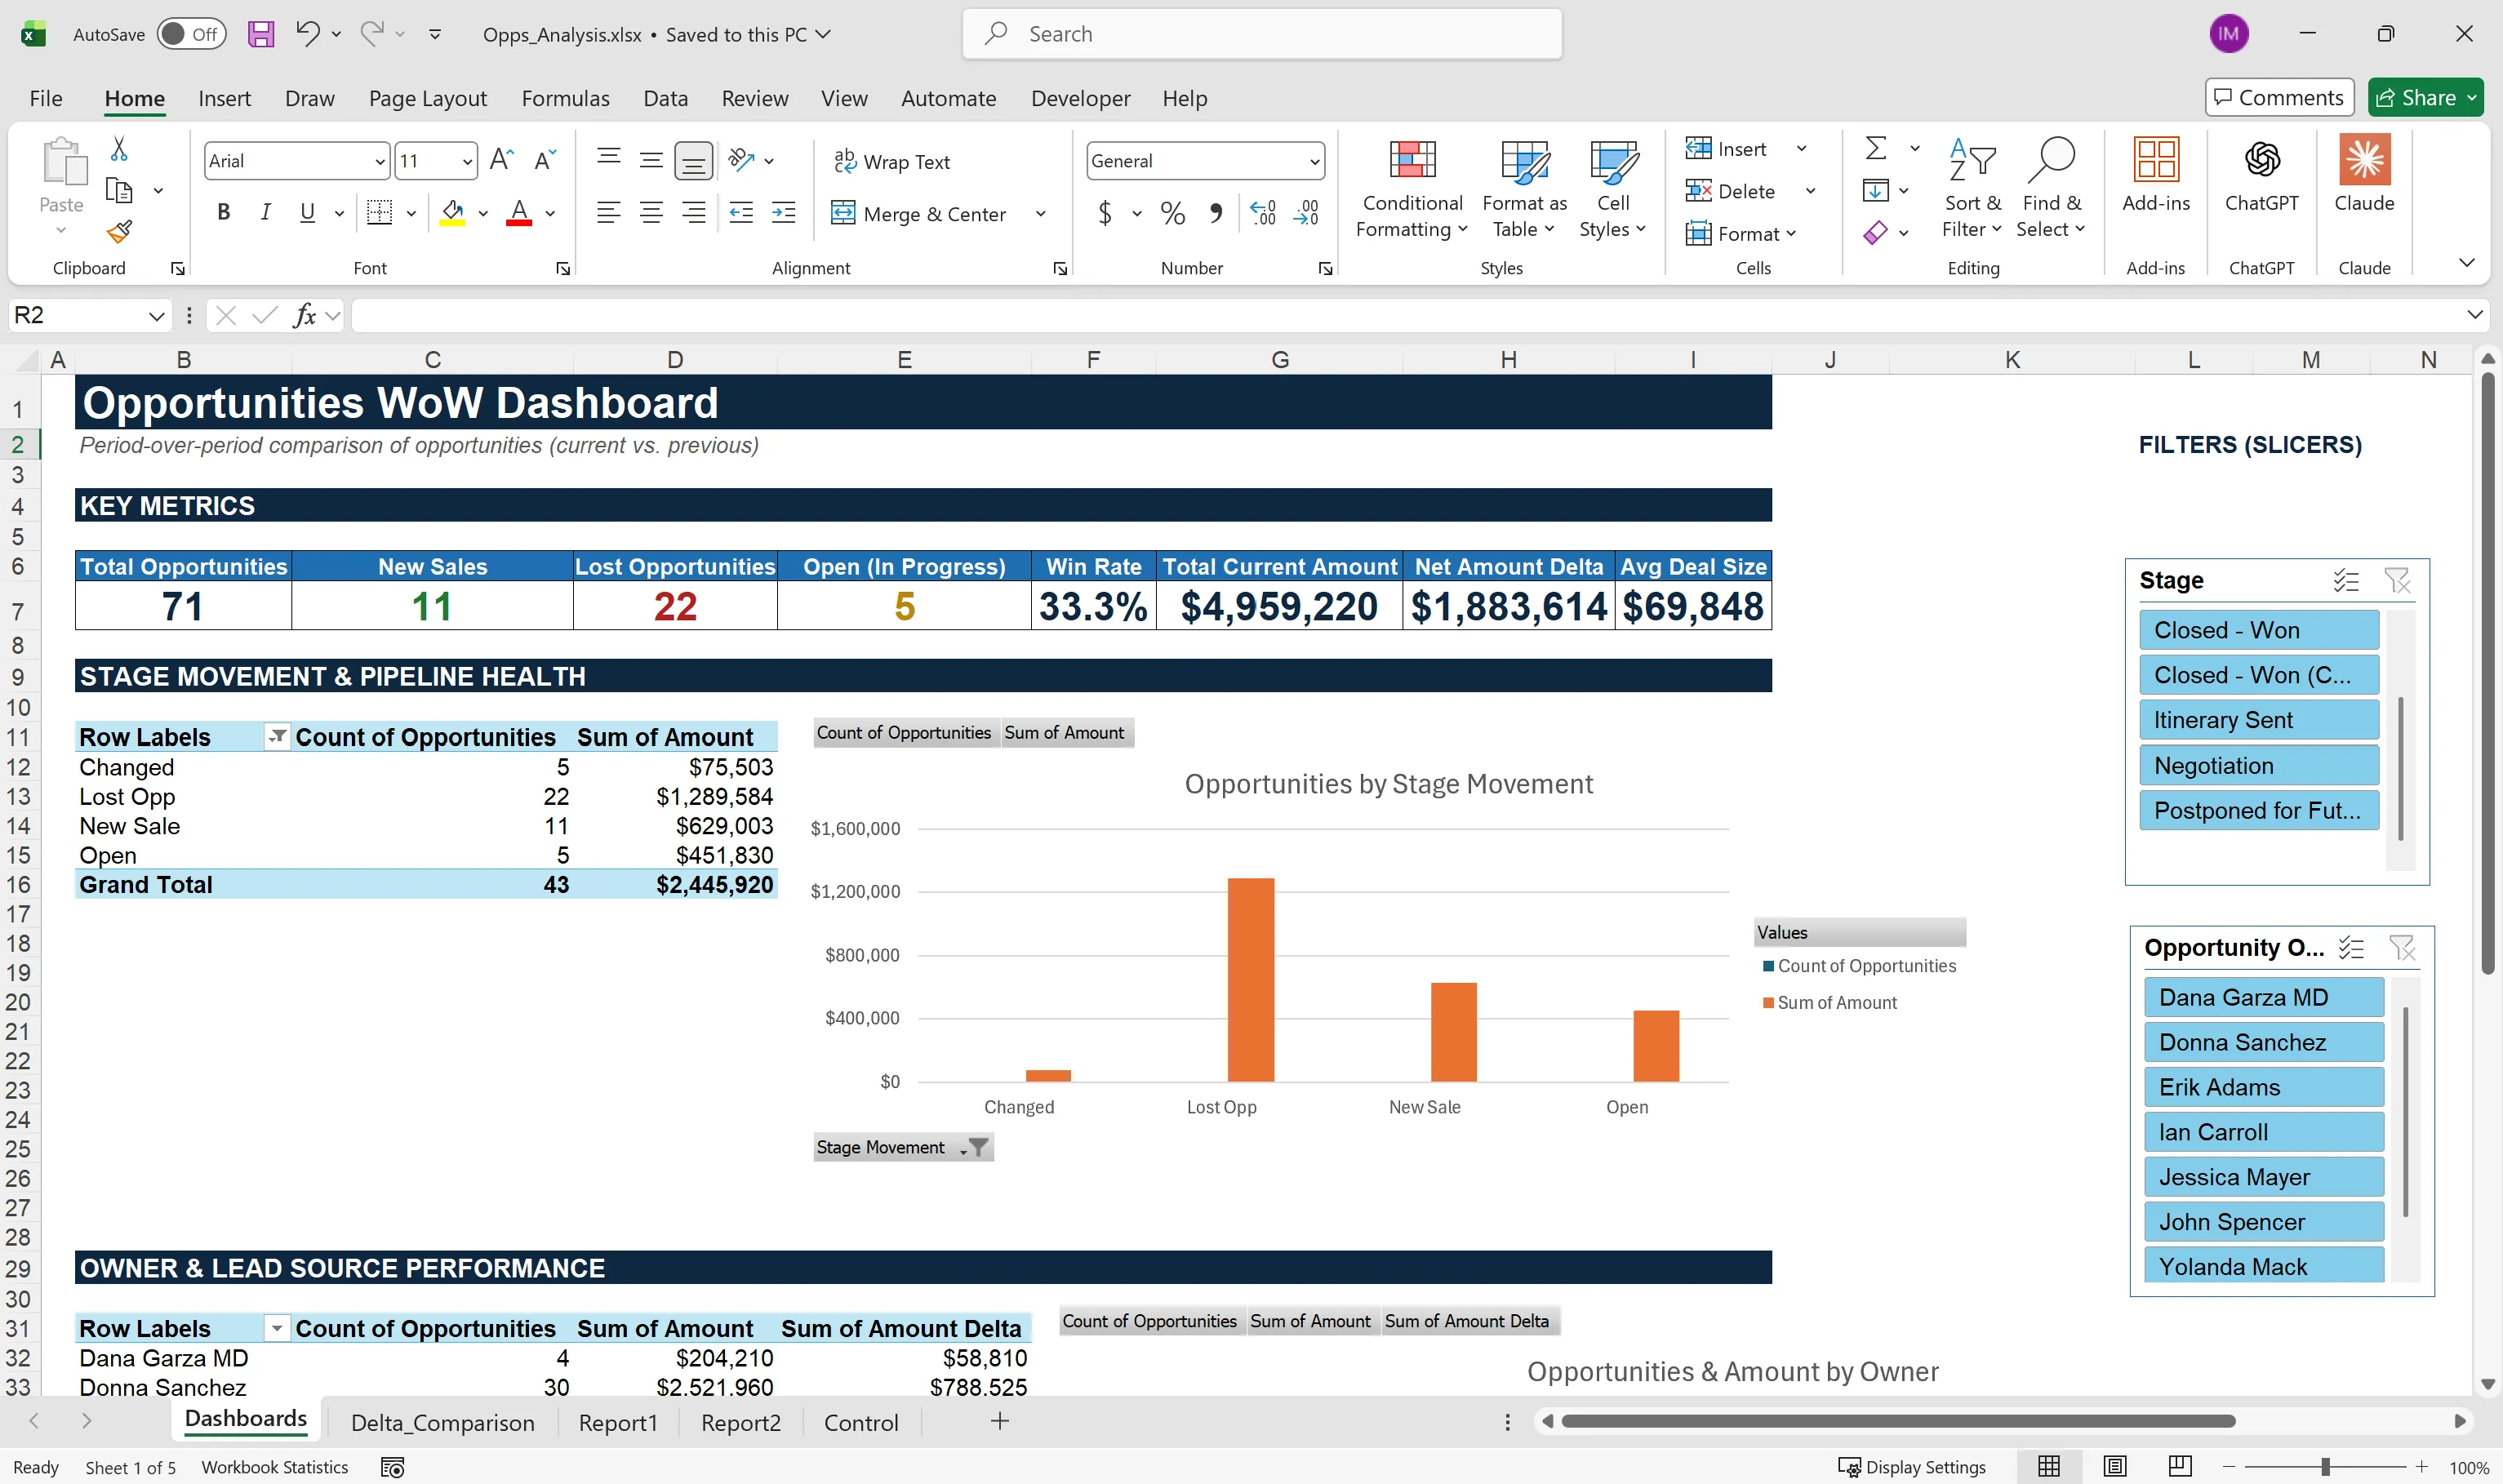
The output a person actually reads in the sales meeting. Each row is bucketed into a movement category, with the current and prior stage and amount shown side by side. See the full 71-row synthetic sample in the interactive demonstration below.
| Opportunity Name | Movement | Stage → Previous | Amount Δ | Owner |
|---|---|---|---|---|
| 2207-1400 Giles Joshua 03 | New Sale | Closed - Won | +$114,600 | Yolanda Mack |
| 2009 Duncan David 02 | Lost Opp | Postponed for Future | +$59,640 | Dana Garza MD |
| 2006-1500 Singh Elizabeth 04 | Changed | Closed - Won (Cancelled) | +$21,176 | John Spencer |
| 2605 Estrada, Kirk 01 | Open | Negotiation ← Postponed for Future | - | Dana Garza MD |
| 2202-1800 Fields Tricia 02 | No Change | Closed - Won ← Closed - Won | +$6,000 | John Spencer |
Interactive Demonstration
This public version recreates the reporting workflow using synthetic data.
The browser-based interface below extends the original implementation by letting visitors interactively filter and search the comparison results, by movement type or by owner, while preserving the same underlying comparison logic used in production.
Illustrative sample results (synthetic data, not historical client figures): across the 71-row synthetic comparison sample, 11 opportunities were classified as new sales, 22 as lost or postponed, 5 as changed within the same outcome, and 5 as still open and moving. The net amount delta across all categories in this sample was roughly +$1.88M, a figure meant to show what the report surfaces, not a real client result.
08Outcome
Operational Outcome
Reduced a manual, spreadsheet-driven reporting process to a repeatable workflow requiring only a refresh and snapshot selection. The reporting process became faster, more consistent, and significantly easier to audit.
Decision Outcome
Sales leadership gained a reliable week-over-week view of pipeline evolution rather than relying on point-in-time CRM reports or manual comparisons. The reporting output consistently highlighted:
- New opportunities
- Won deals
- Lost opportunities
- Pipeline movement
- Value changes
- Stage progression
Data Outcome
Perhaps the most valuable result was the creation of a historical analytical dataset. Instead of generating reports that disappeared after each meeting, every weekly extraction became part of a structured archive that could be reused across multiple analytical workflows. The same dataset later supported:
- Forecast validation
- Revenue planning
- KPI reporting
- Historical trend analysis
Those downstream uses are outside the scope of this demonstration but were an important objective of the original solution.
Download Sample Excel Workbook09Technical Notes
This section focuses on implementation details for readers interested in the engineering behind the solution: Salesforce extraction with Power Query, snapshot architecture, historical comparison logic, movement classification, and VBA automation. The business value of the project came from the reporting architecture itself rather than any individual technology, Power Query, VBA, and Excel were implementation choices selected because they integrated naturally with the client's existing processes while requiring virtually no change management for end users.
Salesforce extraction (Power Query M): connects to the Opportunity object, flattens the Owner lookup, and selects twelve fields, including three custom fields, before renaming every header to a human-readable label:
Salesforce extraction (Power Query M)
Source = Salesforce.Data("https://login.salesforce.com/", [ApiVersion=48, CreateNavigationProperties=true]),
Opportunity1 = Source{[Name="Opportunity"]}[Data],
ExpandOwner = Table.ExpandRecordColumn(Opportunity1, "Owner", {"Name"}, {"Owner.Name"}),
SelectCols = Table.SelectColumns(ExpandOwner, {
    "Id", "Name", "CloseDate", "StageName", "Amount", "LeadSource",
    "Owner.Name", "CreatedDate", "Loss_Reason__c",
    "Original_Lead_ID__c", "Probability", "Notes_Status__c"
}, MissingField.UseNull),
RenameCols = Table.RenameColumns(SelectCols, {
    {"Id", "Opportunity ID"}, {"Name", "Opportunity Name"},
    {"CloseDate", "Close Date"}, {"StageName", "Stage"},
    {"LeadSource", "Lead Source"}, {"Owner.Name", "Opportunity Owner"},
    {"CreatedDate", "Created Date"}, {"Loss_Reason__c", "Loss Reason"},
    {"Original_Lead_ID__c", "Original Lead ID"},
    {"Probability", "Probability (%)"}, {"Notes_Status__c", "Notes/Status"}
})
MissingField.UseNull means a renamed or deleted Salesforce field won't break the weekly refresh. It returns a null column instead of an error, the safer failure mode for an unattended process, though it still means someone has to monitor for silent schema drift. The final rename step matters beyond readability: its output headers are the exact contract Opps_Analysis.xlsx expects when it reads the CSV back in. Change a header here and the downstream file's type-casting step stops finding that column.
Self-locating snapshot folder (portfolio extension): rather than a folder path hardcoded as text, the Control sheet derives its own location from the workbook's file path:
Control sheet: self-locating Data folder
=LEFT(CELL("filename",A1), FIND("[",CELL("filename",A1))-1) & "Data\"This replaces a genuine limitation in an earlier version: two independently hardcoded, unlinked paths that both had to be updated by hand if the shared folder ever moved.
Comparison join (original): Delta_Comparison starts from a left-outer join of the current snapshot against the prior one on Opportunity ID, so every row from the newer file is kept even when nothing matches in the older one:
Snapshot join (Power Query M)
Source = Table.NestedJoin(Report1, {"Opportunity ID"}, Report2, {"Opportunity ID"}, "Previous", JoinKind.LeftOuter),
ExpandedPrevious = Table.ExpandTableColumn(Source, "Previous", {"Stage", "Amount"}, {"Previous.Stage", "Previous.Amount"})
A row with no match, meaning the opportunity doesn't exist in the older snapshot, comes back with Previous.Stageand Previous.Amount both null. That null check is what the stage bucketing below builds on.
Stage bucketing and movement classification (portfolio extension): the core of the rebuilt comparison logic, ported from a manual stage-checkup formula into the query itself:
Stage bucketing (Power Query M)
StageCategory = (s as nullable text) as nullable text =>
    if s = null then null
    else if List.Contains({"Closed - Won", "Closed Won - 100%"}, s) then "Won"
    else if List.Contains({"Closed - Lost", "Closed Lost - 0%", "Postponed for Future"}, s) then "Lost"
    else if s = "Closed - Won (Cancelled)" then "Cancelled"
    else if s = "Closed - Internal" then "Internal"
    else "Open"
Every matched opportunity is bucketed on both the current and prior snapshot, then classified into New Sale, Lost Opp, Changed, Open, or no movement. Only rows with a real movement or dollar change survive the final filter. That's the direct fix for a flaw in an earlier version of the query: it kept only rows with no match in the prior snapshot, meaning brand-new opportunities, and discarded every stage or amount change on a continuing deal even though the join above made that comparison possible.
Weekly snapshot automation (VBA): one macro, triggered by a single button, that copies the live Salesforce table to a dated CSV and then refreshes the connection for next week:
Weekly snapshot macro (VBA)
folderPath = ThisWorkbook.Path & "\Data\"

If Dir(folderPath, vbDirectory) = "" Then
    MkDir folderPath
End If

filePath = folderPath & "Opps_" & Format(Date, "YYYY-MM-DD") & ".csv"
snapshotSheet.Copy
ActiveWorkbook.SaveAs Filename:=filePath, FileFormat:=xlCSVUTF8
ActiveWorkbook.Close SaveChanges:=False
ThisWorkbook.RefreshAll
The path is built from ThisWorkbook.Path, not typed in, so the macro still finds its own Data folder if the whole project is ever moved, and the folder gets created automatically the first time the macro runs against a fresh copy. The snapshot is written before the refresh, so each CSV always reflects exactly what was on screen at the moment of the click. It's a deliberate, auditable behavior, even though it means clicking the button doesn't pull live, real-time data.
10Disclosure
This case study reflects a real client engagement. To preserve confidentiality, all names, amounts, dates, and records shown throughout this case study have been anonymized or synthetically generated, using a reduced record count built to demonstrate the same mechanics at a shareable scale.
The underlying reporting architecture, comparison methodology, and workflow accurately represent the production solution while protecting confidential client information.