F&B Franchise Expansion Equity Raise
Financial model, investor memorandum, and fundraising materials
Built the financial model and investor materials that supported a regional café licensing expansion across the Middle East, translating one successful operating location into a defensible investment case that ultimately secured $400,000 of equity financing.
- Problem
- A single successful café location needed a defensible case for multi-country expansion, without extrapolating results from one market to seven.
- What I Built
- A 36-month integrated financial model and investment memorandum underwriting each of 7 planned markets independently.
- Impact
- Supported a raise that closed at $400K for 10% equity, a smaller check at a higher implied valuation than the original $1M/20% ask.
- Stack
- ExcelFinancial ModelingScenario & Sensitivity AnalysisValuation
Project Summary
- Role
- Financial Modeler & Investment Memorandum Author
- Sector
- Hospitality & IP Licensing
- Project Type
- 36-month integrated financial model and investor memorandum for a multi-country licensing expansion
- Tools
- Excel, Financial Modeling, Scenario & Sensitivity Analysis, Valuation
- Input
- Single-market operating history, country assumptions, planned store openings
- Output
- Integrated financial statements, valuation range, investment memorandum
10
Planned store openings
Across 7 countries
36 Months
Forecast horizon
Modeled at monthly granularity
$400K / 10%
Capital raised
vs. $1.0M / 20% originally proposed
Impact
- Converted a proven single-location business into an investor-ready regional expansion strategy.
- Built a monthly integrated model covering operating performance, cash flow, financing requirements, and valuation.
- Reconciled commercial cash flows with accounting treatment for long-term licensing agreements.
- Produced the financial analysis used during investor discussions, ultimately supporting a successful equity raise.
Investor Outcome
$400K RAISED FOR 10% EQUITY
The original fundraising objective was $1 million in exchange for 20% equity. Following investor discussions, the transaction closed at $400,000 for 10%, implying a higher valuation than originally proposed while providing sufficient capital for the next stage of regional expansion.
Decision Context
The business had already proven that the concept could work. The uncertainty was whether a single successful café could justify expansion across multiple countries, each with different commercial conditions, operating costs, and market dynamics.
Reaching that next stage meant negotiating new licensing agreements, traveling to meet prospective operators, adapting the concept to each local market, and funding that commercial effort long before any new café opened its doors.
Before approaching investors, management needed reliable answers to several questions:
- How much capital was actually required to execute the expansion?
- When would cash be needed throughout the rollout?
- How sensitive was the business to delays in store openings?
- What valuation could be supported by realistic operating assumptions?
- Would the expansion generate attractive returns for new investors?
Answering these questions required far more than projecting revenue growth. The financial model had to connect licensing agreements, opening schedules, country-specific assumptions, operating performance, cash flow, financing, and investor returns into a single integrated framework.
The Problem
One successful café demonstrated that the operating model could work. It did not prove that the same results could be replicated across seven different countries.
Existing situation
Required outcome
Only one market had operating history; every other country risked reusing its curve.
Transparent, editable country assumptions built from GDP per capita, tourism exposure, and F&B growth.
Gulf and Mediterranean café demand move on different calendars.
A distinct seasonality curve per country instead of one blended monthly pattern.
Ten stores opened across a 37-month window, not on one date.
Every forecast month knows exactly which stores are live and which country curve and fees apply.
An upfront fee and a monthly royalty land on the books on different schedules.
Cash and accounting treatment modeled and reconciled separately, not blended.
Each market required its own assumptions for demand, timing, licensing economics, and operating performance. Without country-level underwriting, investors would effectively be assuming that one successful location represented the entire region. The objective was to replace that assumption with a transparent financial model that evaluated each country independently while still producing one consolidated investment case.
Model Architecture
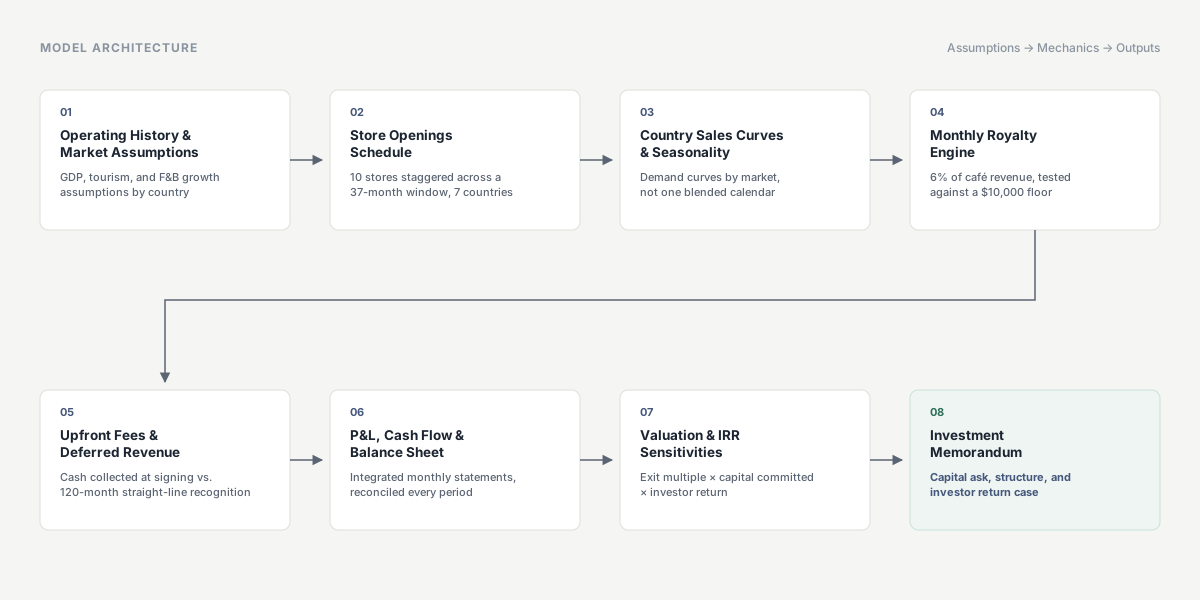
The model is built as a chain of structured tables, each with one job, passing a controlled output into the next.
Monthly royalty engine, in short
For every one of the 36 forecast months, the model identifies which stores are open, applies the right country curve, estimates café revenue, and runs it through the 6% royalty rate against the $10,000 monthly floor. Structured formulas connect the openings table to the monthly statements, so a revised opening date or a new store flows through automatically rather than requiring manual rework.
Selected Work
Sample Investment Presentation
Investment presentation: synthetic sample deck
Planned Expansion Schedule
| # | Country | City | Opening | Initial Fee | 36-Mo Royalties |
|---|---|---|---|---|---|
| 1 | Saudi Arabia | Riyadh | May 2023 | $400,000 | $440,000 |
| 2 | Saudi Arabia | Jeddah | Jun 2024 | $150,000 | $310,000 |
| 3 | Qatar | Doha | Oct 2024 | $400,000 | $278,242 |
| 4 | UAE | Dubai | Nov 2024 | $400,000 | $275,442 |
| 5 | UAE | Abu Dhabi | Mar 2025 | $150,000 | $231,953 |
| 6 | UAE | Dubai Airport | May 2025 | $150,000 | $211,733 |
| 7 | Kuwait | Kuwait City | Aug 2025 | $400,000 | $172,959 |
| 8 | Turkey | Istanbul | Dec 2025 | $400,000 | $130,000 |
| 9 | Morocco | Marrakech | Mar 2026 | $400,000 | $100,000 |
| 10 | Egypt | Cairo | Jun 2026 | $400,000 | $70,399 |
| Total | $3,250,000 | $2,220,728 | |||
Later openings show lower cumulative royalties within the 36-month window: not weaker economics, just fewer contributing months before the forecast cutoff.
Three-Year Financial Outlook
| Year | Revenue | EBITDA | Margin | Cash Position |
|---|---|---|---|---|
| 2024 | $308,289 | ($32,876) | −11% | $1,251,707 |
| 2025 | $912,594 | $437,342 | 48% | $2,611,549 |
| 2026 | $1,465,204 | $880,400 | 60% | $3,990,283 |
EBITDA is shown in parentheses for the year-one operating loss, per standard accounting convention.
Exit-Multiple & Investor-Return Sensitivity
| Yr-3 EBITDA Multiple | Yr-3 Valuation | Value of 20% Equity | Capital for 25% IRR | Illustrative IRR |
|---|---|---|---|---|
| 6.0x | $6,561,939 | $1,312,388 | $671,943 | 9.5% |
| 8.0x | $8,321,217 | $1,664,243 | $852,093 | 18.5% |
| 10.0x | $10,080,495 | $2,016,099 | $1,032,243 | 26.3% |
The sensitivity makes the source of the return visible: how much depends on operating growth, versus how much depends on the exit multiple and capital committed.
06Outcome
One consistent framework replaced a narrative extrapolated from a single successful café: an explicit opening schedule, country-level assumptions, a monthly cash forecast, reconciled accounting treatment, and transparent investor-return sensitivities.
Proposed: $1.0M for 20% equity. Closed: $400,000 for 10% equity, a smaller check at a higher implied valuation. Three outlets opened following the raise; the regional license was later repurchased by the parent brand at a profit to the owner.
07Technical Notes
Designed for a repeatable, auditable investor review.
- 36-month forecast at monthly granularity, rolled into annual summary views for the investment memorandum.
- Country assumptions and the store-openings schedule live in structured tables, not hardcoded ranges.
- Operating, accounting, and investment calculations are kept in separate, clearly labeled model sections.
- A dedicated deferred-revenue schedule reconciles the P&L, cash flow statement, and balance sheet every month.
Representative Formulas
Monthly royalty calculation
=MAX(
    EstimatedCafeRevenue * RoyaltyRate,
    MinimumMonthlyRoyalty
)
Applies the 6% royalty rate while enforcing the $10,000 monthly minimum.
Upfront fee recognition
=InitialLicenseFee / LicenseTermMonthsStraight-line monthly recognition of the upfront license fee over a 120-month term.
Deferred revenue roll-forward
=OpeningDeferredRevenue + NewFeesCollected - RevenueRecognizedTies the cash and accounting views together on the balance sheet each month.
08Files
09Disclosure
This case study is based on a historical client engagement supporting a hospitality operator's multi-country licensing expansion.
Company and brand names have been fictionalized; "Café Muse" is a placeholder and does not identify an actual client. Figures are presented as prepared and anonymized by the author and should not be read as current or forward-looking projections of any real business.