Stripe Platform Fees Allocation Engine
Allocate Stripe's daily processing costs back to individual transactions, creating accurate transaction-level payment costs for accounting and profitability analysis.
- Problem
- Stripe's package fees and shared payment costs needed to be allocated down to individual transactions for accurate accounting and margin analysis.
- What I Built
- An allocation engine in Power Query and Excel that assigns fees to transactions and reconciles against Stripe's daily totals.
- Impact
- Automated ~95% of the monthly allocation process across 13,000+ transactions and 700+ fee lines, live in production for 1.5 years.
- Stack
- Power QueryExcelDynamic ArraysFinancial Reconciliation
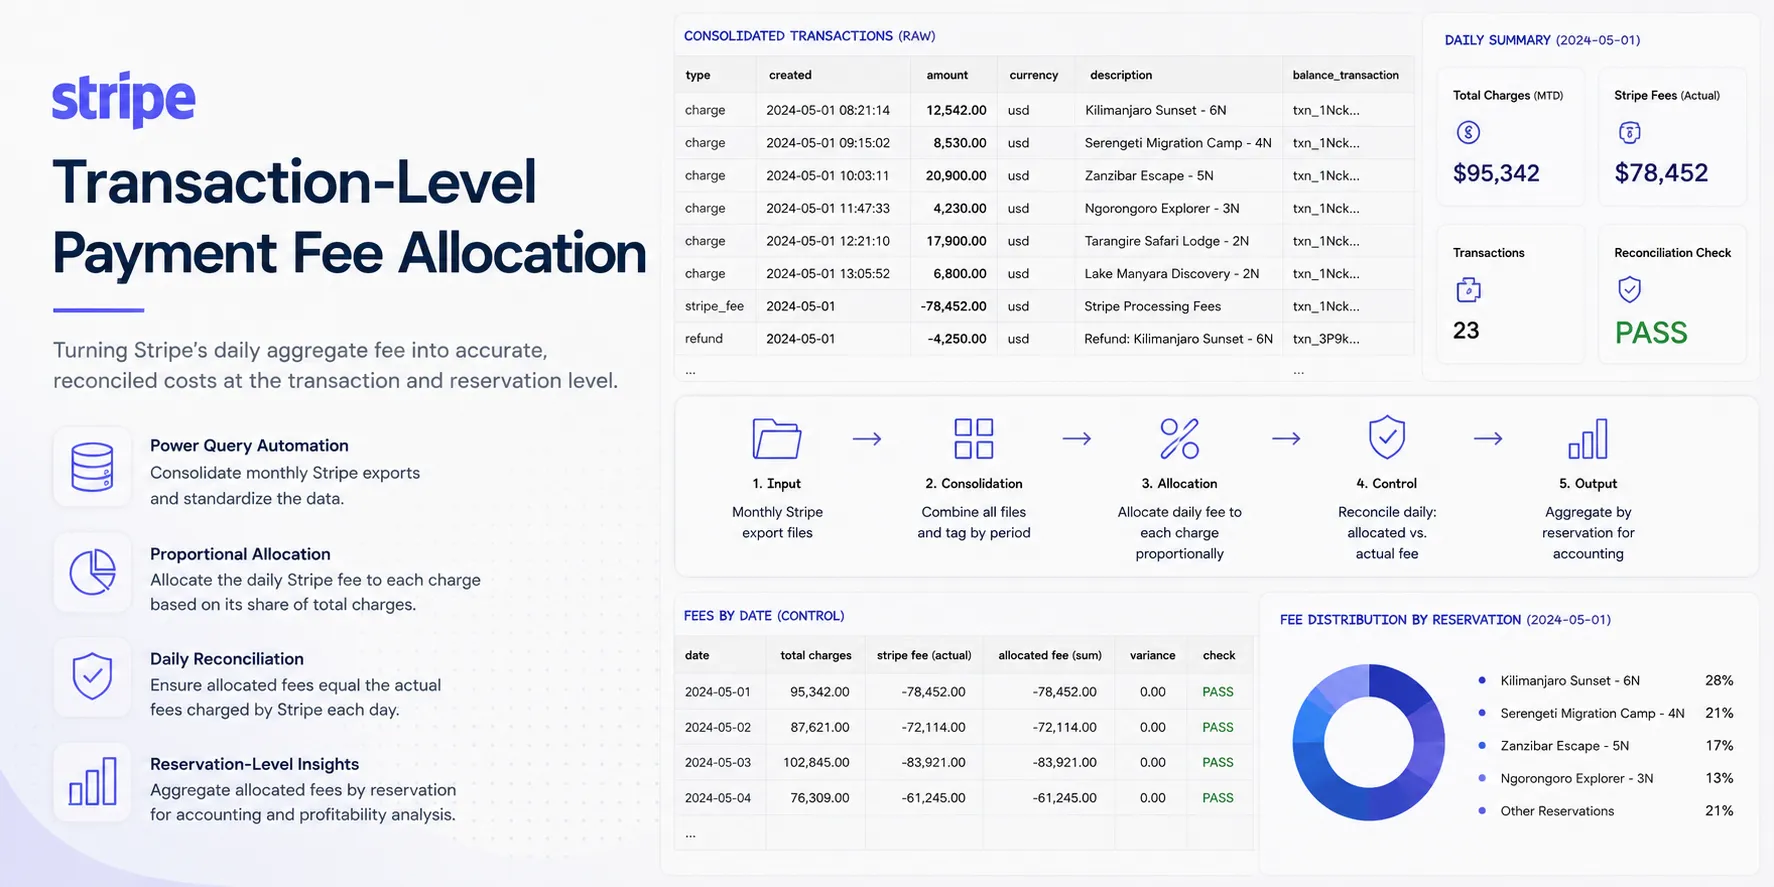
Representative dashboard showing the payment fee allocation workflow and reconciliation process. Company name and financial data have been replaced with synthetic information.
Project Summary
- Role
- Financial Systems Developer & Data Analyst
- Sector
- Embedded Finance and Payment Operations
- Project Type
- Power Query allocation engine and reconciliation workflow
- Tools
- Power Query (M), Microsoft Excel, Dynamic Array Formulas, Financial Planning
- Input
- Monthly Stripe transaction exports
- Output
- Transaction-level allocated fees, reconciliation report
13,000+
Stripe transactions analyzed
700+
Lines of Stripe fees assigned
1.5 yrs
Live in production
Monthly
Refresh new Stripe Reports
~95%
Workflow automated
Daily
Reconciliation control
Input
Output
Decision Context
Stripe records its package fees and operational costs as daily line items with no direct relationship to individual transactions.
Accounting needed a repeatable way to distribute those aggregate costs back to every payment so each sale carried its complete payment-processing cost.
The model needed to create transaction-level payment cost information that previously did not exist, while reducing the monthly allocation process.
The solution also needed to provide independent reconciliation so every allocated dollar could be tied back to Stripe's reported daily totals.
The Problem
Several practical issues prevented accurate transaction-level reporting.
Existing situation
Required outcome
Daily Stripe costs were not linked to individual charges.
Each charge receives a proportional share of that day's cost.
Monthly exports mixed charges, refunds, adjustments, and fee records.
One consolidated, standardized transaction table.
Large amounts of metadata complicated downstream accounting.
Clean, accounting-ready transaction records.
No relationship existed between Stripe transactions and accounting identifiers.
Sale-level matching to the accounting system.
Without an allocation engine, accounting either had to post aggregate payment expenses without transaction-level detail or manually estimate allocations every month, and both approaches reduced accuracy and increased the effort required during month-end close.
System Architecture
The workbook follows a five-stage processing pipeline.
01
Monthly Stripe exports
Raw monthly exports as received from Stripe.
02
Folder Ingestion
Monthly Stripe exports are automatically imported from a monitored directory using Power Query.
03
Data Consolidation
Every export is merged into a single standardized transaction table while preserving source metadata.
04
Daily Allocation
Each transaction receives a proportional share of that day's aggregate Stripe revenue (clients) based on its contribution to the day's payment volume.
05
Reconciliation
Every calendar day is independently reconciled by comparing Stripe's reported daily fees with the total amount allocated across all transactions.
06
Sale-Level Output
Allocated payment costs are summarized at sale level for accounting, COGS reporting, and profitability analysis.
Selected Work
Automated Data Consolidation
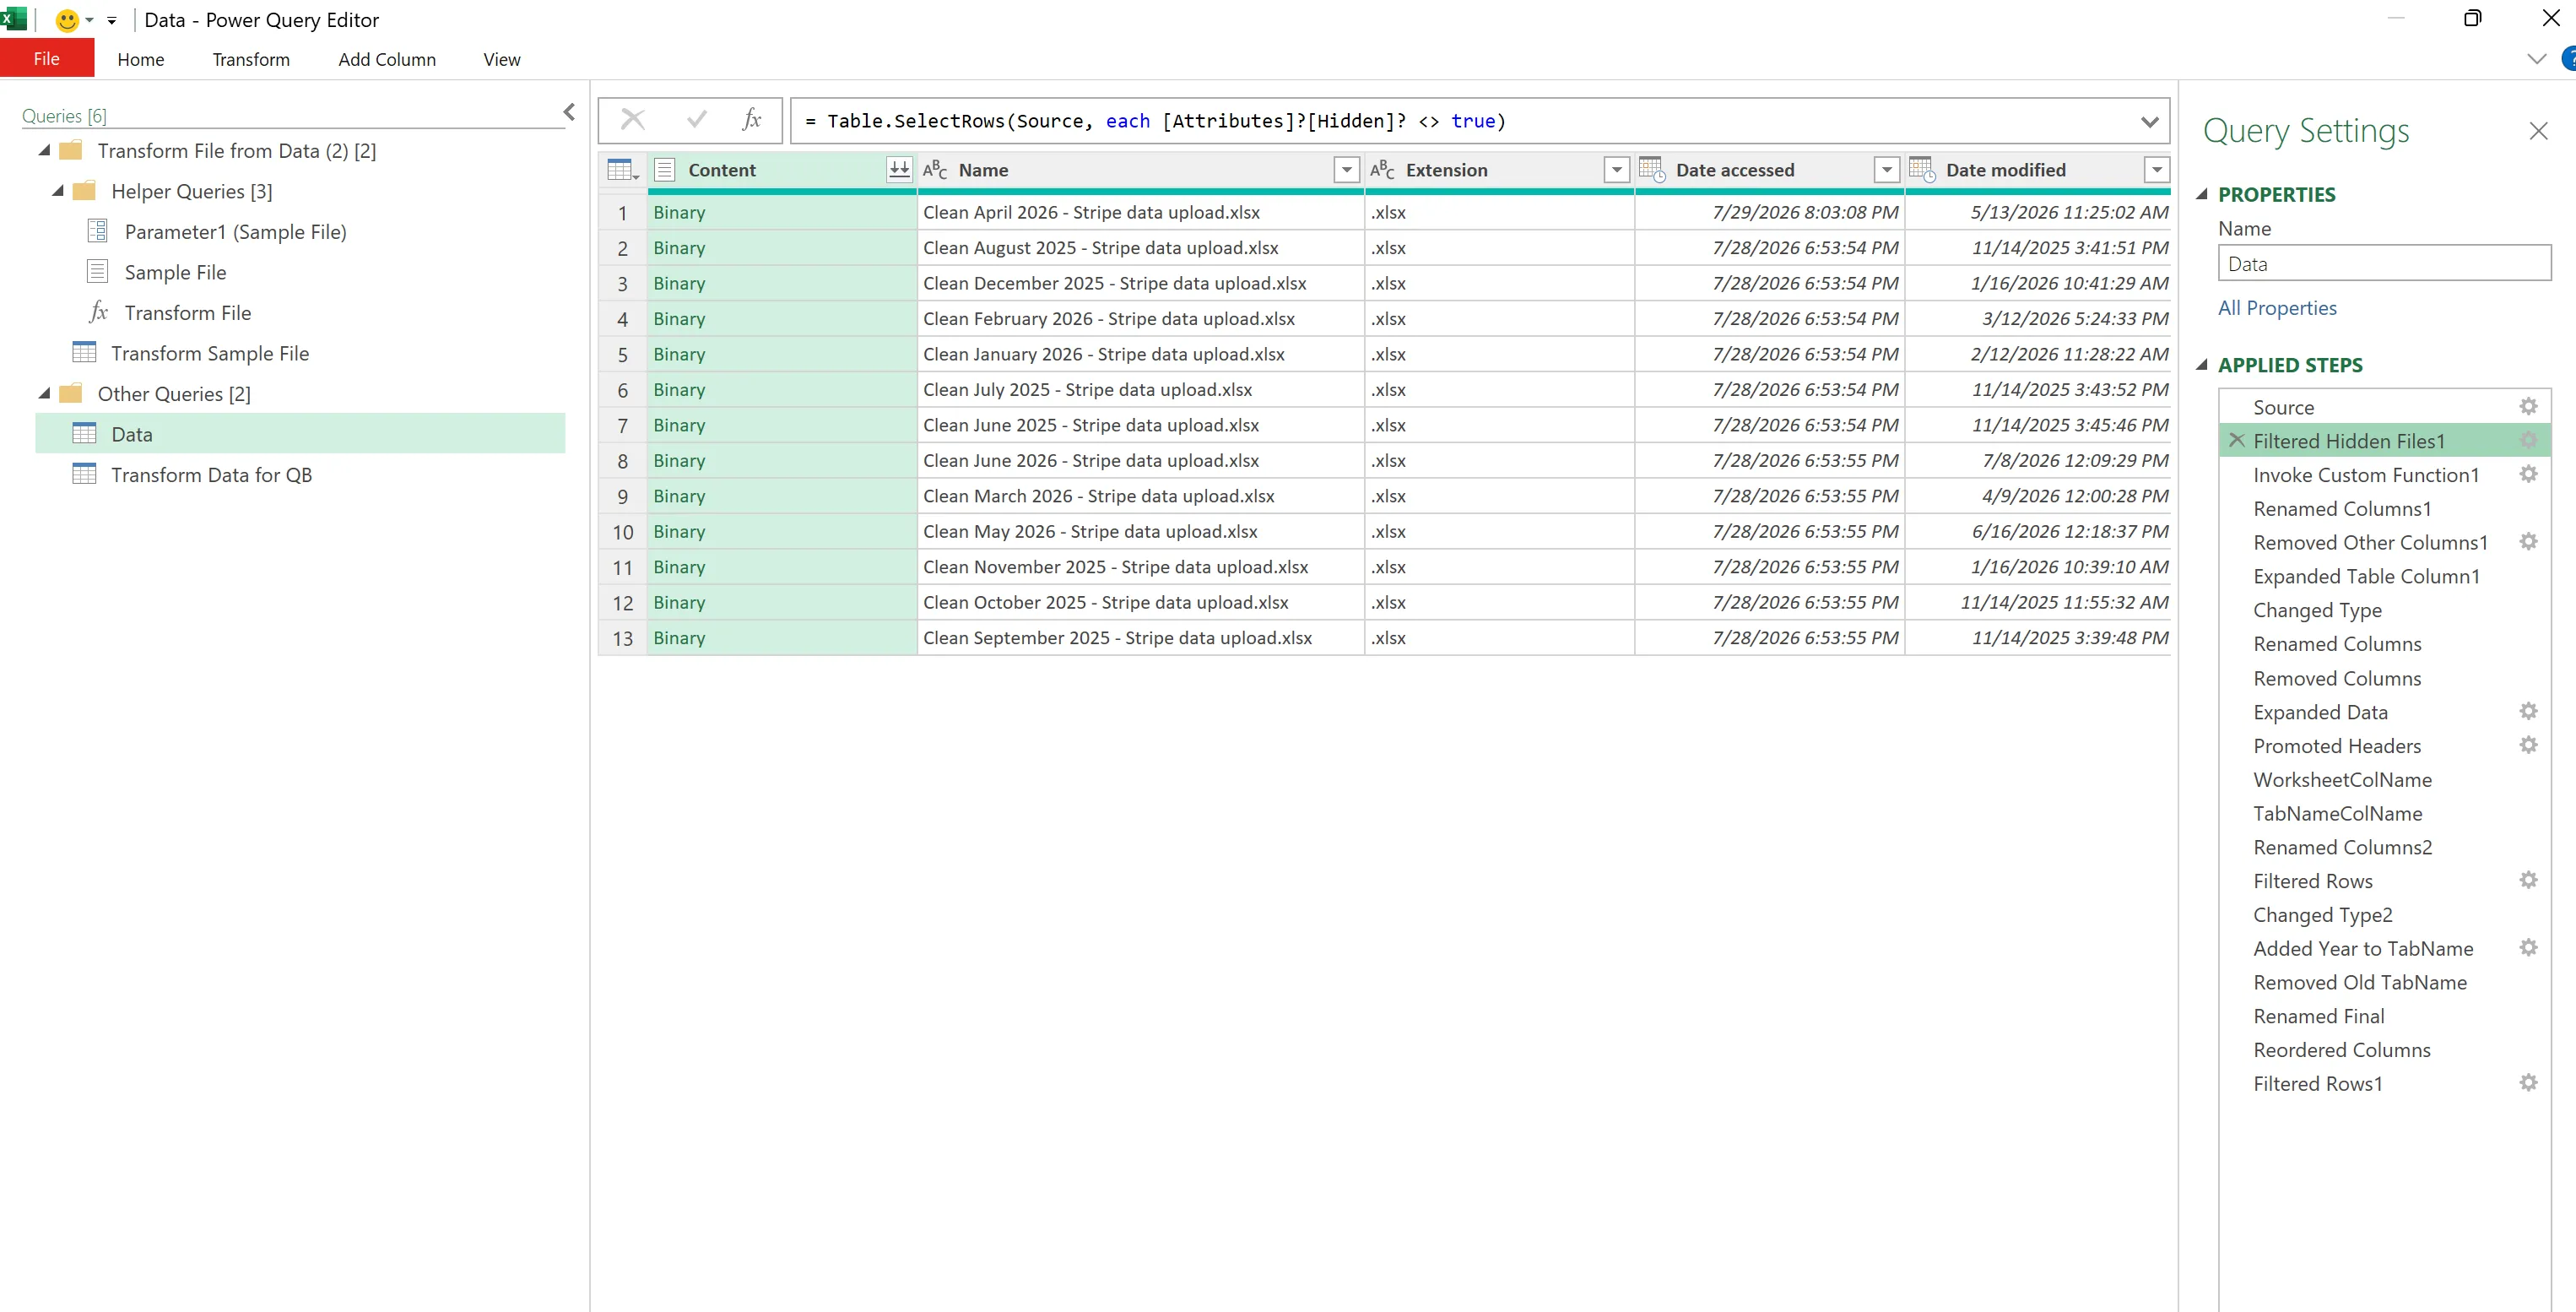
Power Query imports every monthly Stripe export from a folder, eliminating manual copy-and-paste and allowing the model to scale simply by adding new files.
- Capability demonstrated
- Folder-based data ingestion that scales without manual file handling.
- Why it mattered
- Adding a new month meant dropping one file into a folder and refreshing. Nothing else changed.
Reconstructed with synthetic transaction data, same structure as the original.
Unified Transaction Dataset
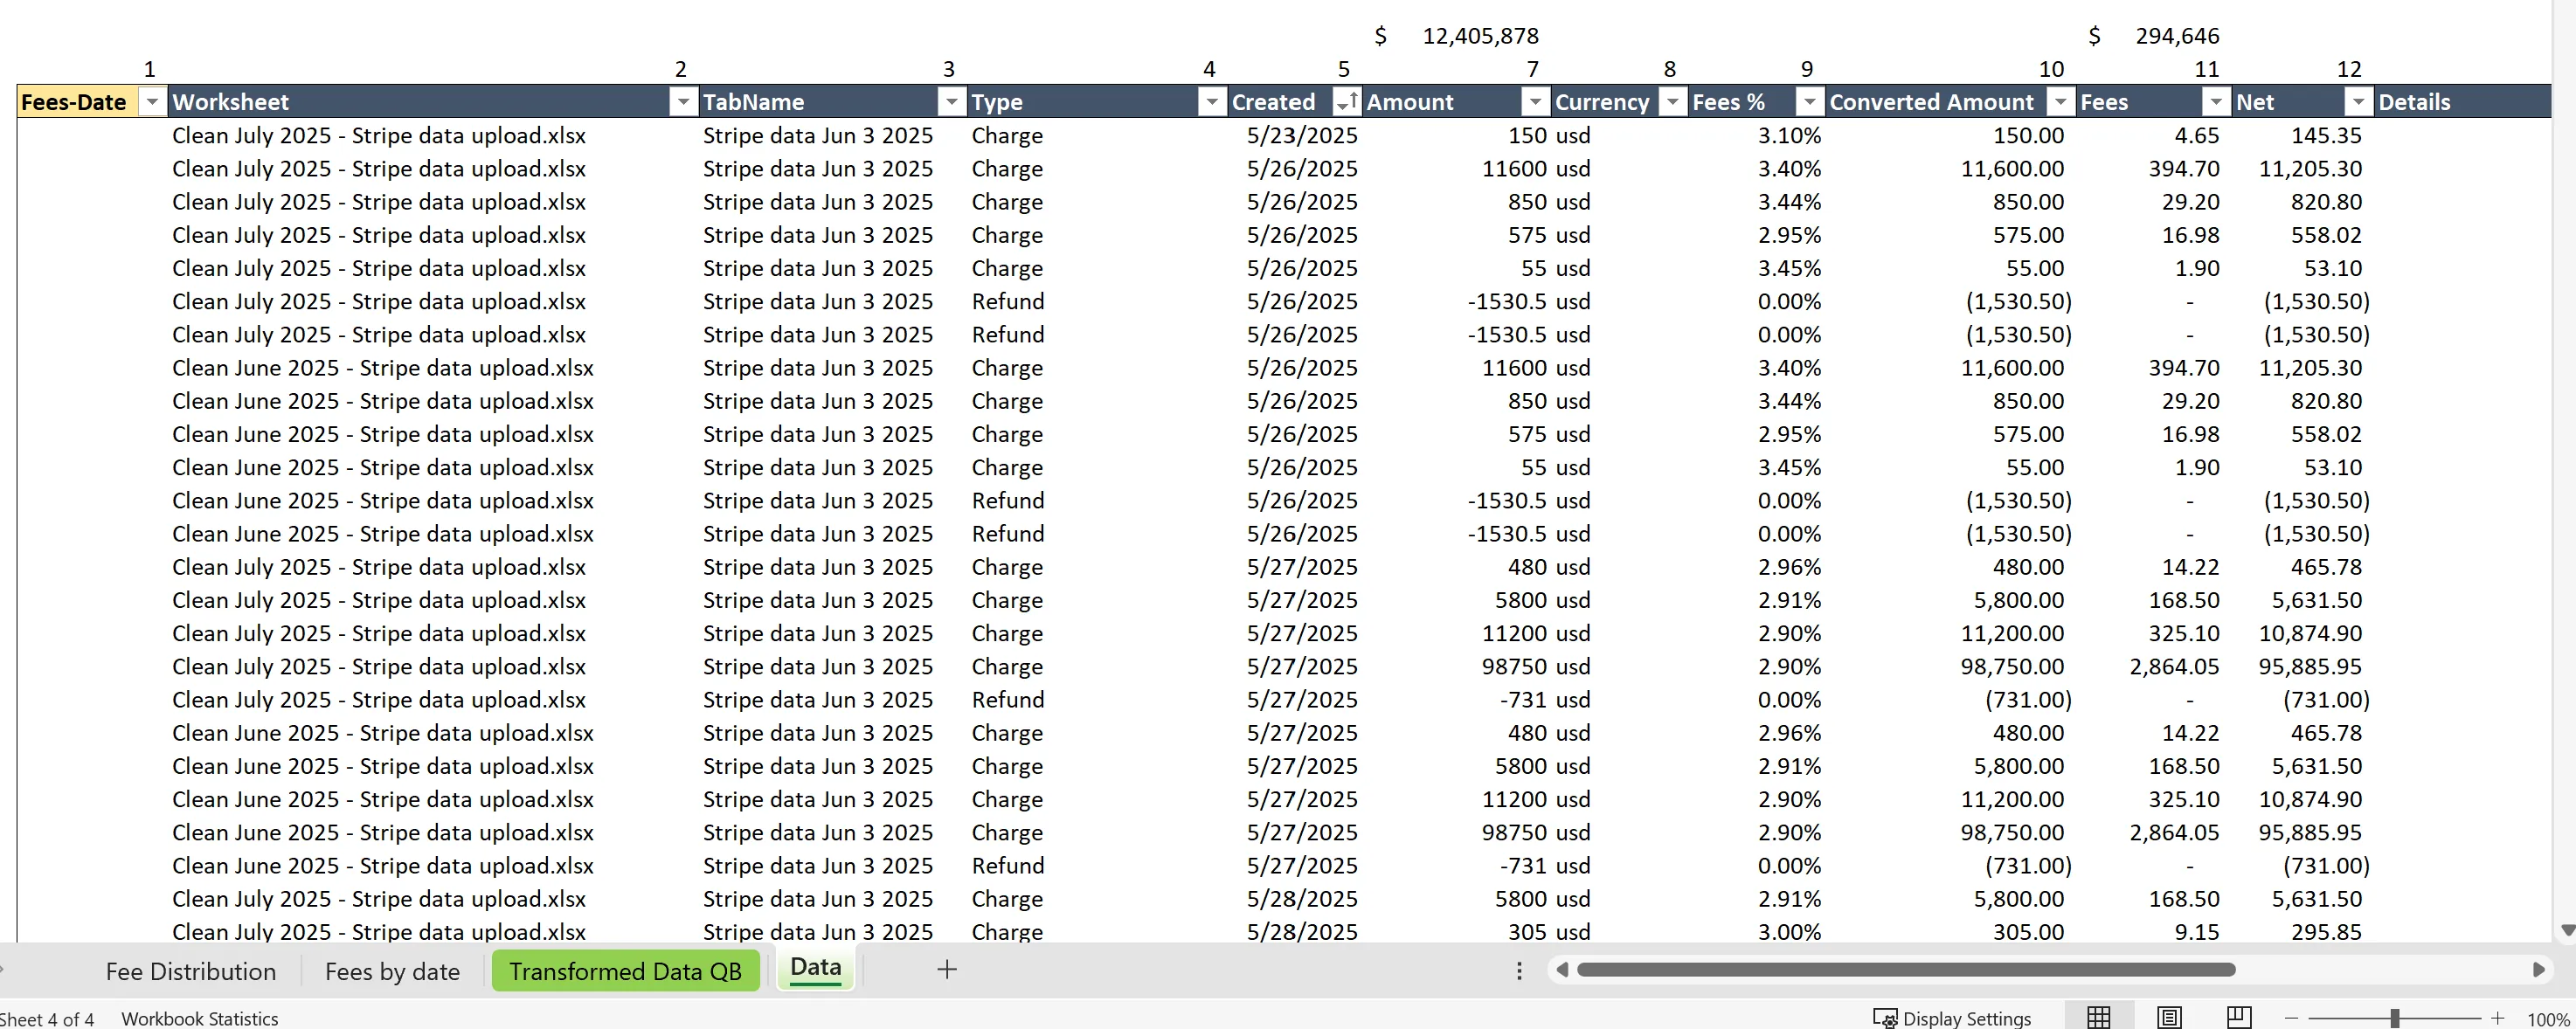
All monthly exports become a single normalized dataset used by every downstream calculation.
- Capability demonstrated
- A single, queryable table standing in for a year of scattered monthly exports.
- Why it mattered
- Everything downstream (allocation, control, reporting) reads from this one table.
Reconstructed with synthetic transaction data, same structure as the original.
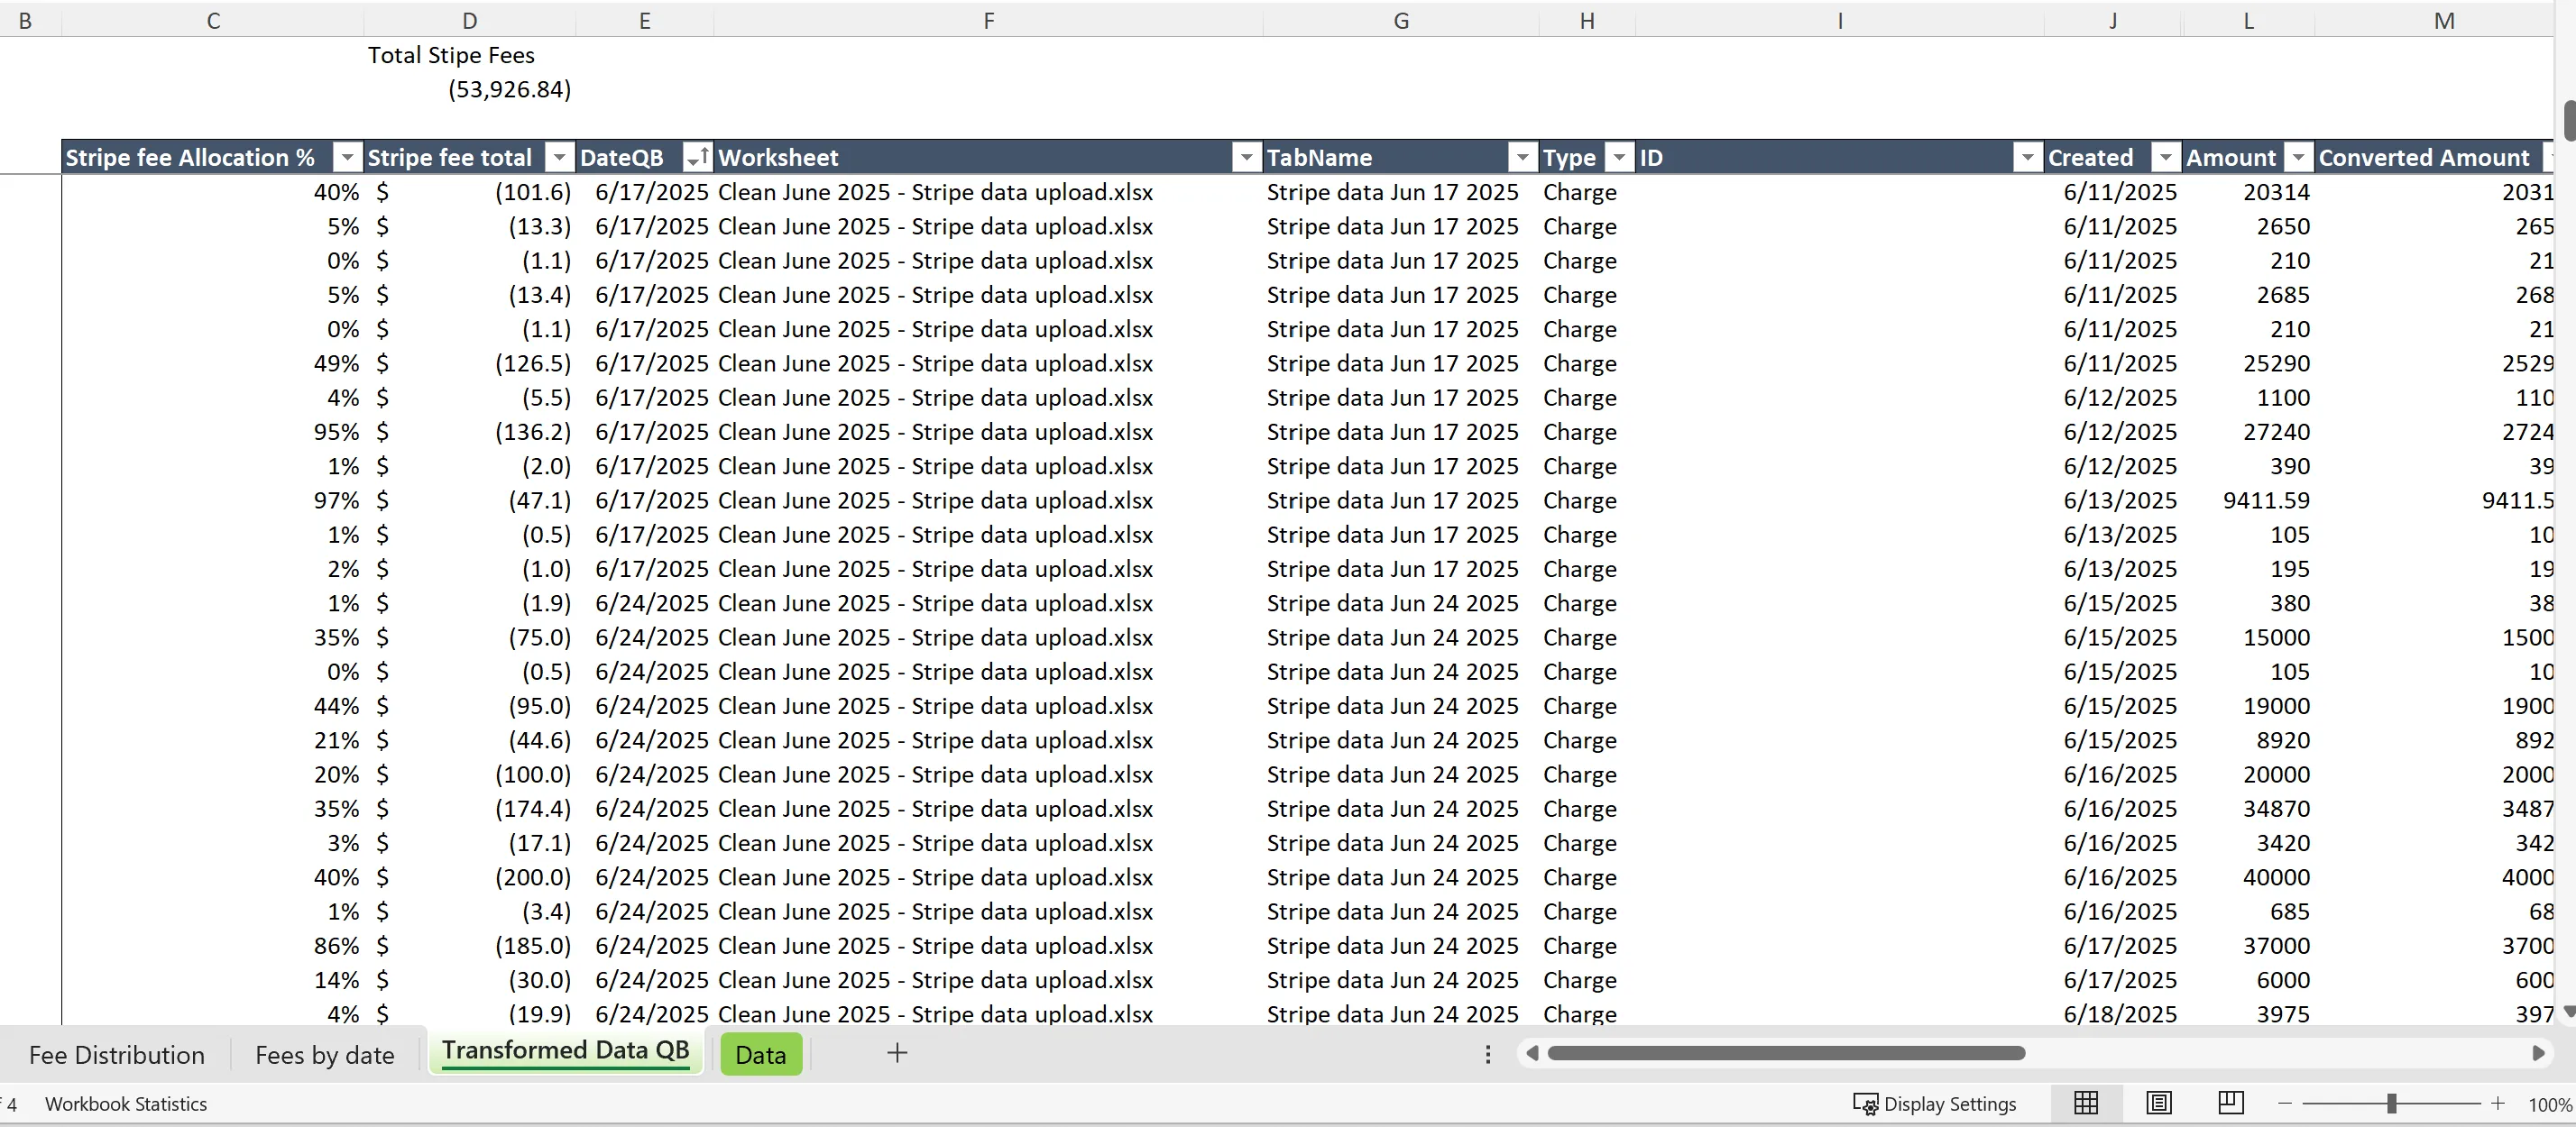
Transaction-Level Allocation
Each payment receives a percentage share of the day's payment volume, providing the allocation basis for Stripe's daily package fees and other non-transaction costs.
- Capability demonstrated
- Proportional cost allocation from an aggregate figure down to individual records.
- Why it mattered
- This percentage is what turns that day's other-cost lines into a defensible per-charge amount.
Reconstructed; formulas rebuilt with generic column names and randomized values.
Daily Reconciliation Controls
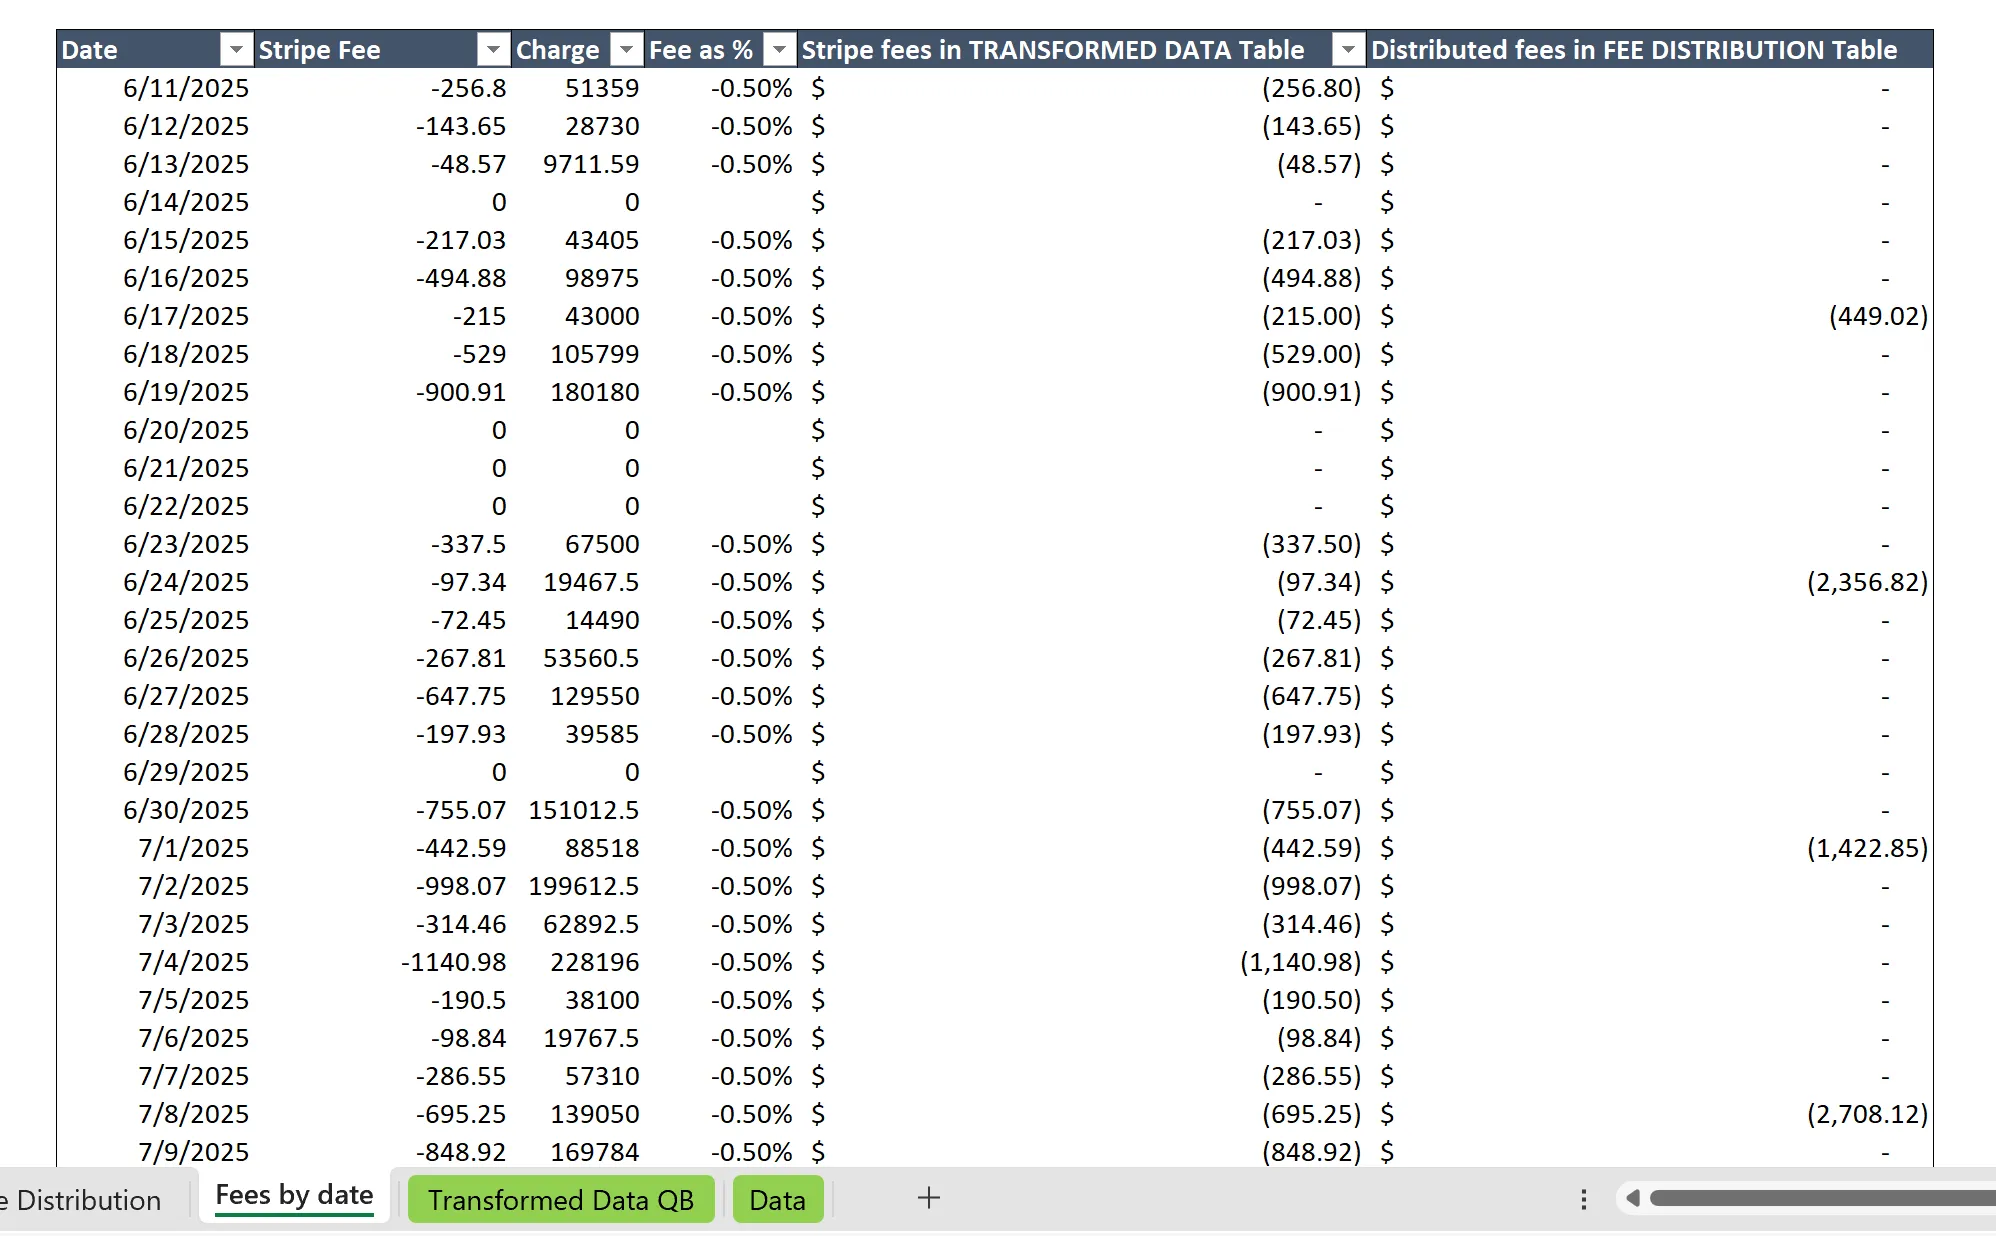
An independent control schedule verifies that allocated fees reconcile exactly to Stripe's reported daily totals before results are published.
- Capability demonstrated
- An independent, self-checking control rather than a one-way calculation.
- Why it mattered
- This is what makes the allocation defensible: a reviewer can see the tie-out, not just trust the formula.
Reconstructed with synthetic daily totals.
Sale-Level Reporting
Allocated payment costs are matched to the accounting system, enabling complete transaction-level COGS and sale-level profitability reporting.
- Capability demonstrated
- Moving from transaction-level detail to the unit of analysis a business actually cares about.
- Why it mattered
- This is what improves COGS detail and supports further profitability review at the sale level.
Not shown; this step matches against internal client and deal codes.
06Outcome
The allocation engine became the standard monthly workflow for transforming Stripe exports into accounting-ready transaction data.
By combining automated ingestion, proportional cost allocation, and independent reconciliation controls, the workbook replaced a repetitive manual allocation process with a refreshable, fully traceable workflow.
Key outcomes
- Reduced the monthly allocation process from several hours of manual work to a single workbook refresh.
- Created transaction-level payment costs where no such information previously existed.
- Enabled sale-level profitability reporting by assigning payment-processing costs to the same commercial units used throughout the accounting system.
- Automated approximately 95% of the recurring monthly workflow while retaining manual review only for exceptions.
- Replaced manual allocation estimates with a deterministic, fully auditable methodology.
- Introduced daily reconciliation controls that independently verified allocated costs against Stripe's reported daily totals.
07Technical Notes
Design Principles
- Folder-based Power Query ingestion
- One consolidated transaction table
- Deterministic allocation methodology
- Independent reconciliation layer
- Fully refreshable workflow
- Dynamic-array reporting
- No manual allocation calculations
Representative Power Query
Data: folder ingestion & consolidation (reconstructed, generic path)
shared Data = let
    // ⚠️ UPDATE THIS PATH to point to your own "Data" folder
    Source = Folder.Files("...\Workfolder\Data"),

    // Ignore any hidden files in that folder
    #"Filtered Hidden Files1" = Table.SelectRows(Source, each [Attributes]?[Hidden]? <> true),

    // Apply the "Transform File" custom function to each file's binary content
    #"Invoke Custom Function1" = Table.AddColumn(#"Filtered Hidden Files1", "Transform File", each #"Transform File"([Content])),

    // Rename "Name" to "Source.Name" to avoid collision after expanding
    #"Renamed Columns1" = Table.RenameColumns(#"Invoke Custom Function1", {"Name", "Source.Name"}),

    // Keep only the file name and the transformed table column
    #"Removed Other Columns1" = Table.SelectColumns(#"Renamed Columns1", {"Source.Name", "Transform File"}),

    // Expand the nested tables (produced by Excel.Workbook) into rows
    #"Expanded Table Column1" = Table.ExpandTableColumn(#"Removed Other Columns1", "Transform File", Table.ColumnNames(#"Transform File"(#"Sample File"))),

    // Set data types for the expanded metadata columns
    #"Changed Type" = Table.TransformColumnTypes(#"Expanded Table Column1",{{"Source.Name", type text}, {"Name", type text}, {"Data", type any}, {"Item", type text}, {"Kind", type text}, {"Hidden", type logical}}),

    // Rename file/sheet identifier columns to friendlier names
    #"Renamed Columns" = Table.RenameColumns(#"Changed Type",{{"Source.Name", "Worksheet"}, {"Name", "TabName"}}),

    // Drop columns not needed going forward
    #"Removed Columns" = Table.RemoveColumns(#"Renamed Columns",{"Item", "Kind", "Hidden"}),

    // Expand the actual sheet data (Column1..Column19) out into real columns
    #"Expanded Data" = Table.ExpandTableColumn(#"Removed Columns", "Data",
        {"Column1", "Column2", "Column3", "Column4", "Column5", "Column6", "Column7", "Column8", "Column9", "Column10", "Column11", "Column12", "Column13", "Column14", "Column15", "Column16", "Column17", "Column18", "Column19"},
        {"Data.Column1", "Data.Column2", "Data.Column3", "Data.Column4", "Data.Column5", "Data.Column6", "Data.Column7", "Data.Column8", "Data.Column9", "Data.Column10", "Data.Column11", "Data.Column12", "Data.Column13", "Data.Column14", "Data.Column15", "Data.Column16", "Data.Column17", "Data.Column18", "Data.Column19"}),

    // Promote the first row of data to become the column headers
    #"Promoted Headers" = Table.PromoteHeaders(#"Expanded Data", [PromoteAllScalars=true]),

    // Grab the (dynamic) names of the first two columns so we can rename them safely
    WorksheetColName = Table.ColumnNames(#"Promoted Headers"){0},
    TabNameColName = Table.ColumnNames(#"Promoted Headers"){1},

    // Rename those first two columns to consistent names
    #"Renamed Columns2" = Table.RenameColumns(#"Promoted Headers",{
        {TabNameColName, "TabName"},
        {WorksheetColName, "Worksheet"}
    }),

    // Remove any leftover header row that got mixed into the data (where Type = "Type")
    #"Filtered Rows" = Table.SelectRows(#"Renamed Columns2", each [Type] <> "Type"),

    // Set proper data types for date and currency fields
    #"Changed Type2" = Table.TransformColumnTypes(#"Filtered Rows",{{"Created", type date}, {"Fees", Currency.Type}}),

    // Build a "TabName + Year" label by pulling the 4-digit year out of the worksheet/file name
    #"Added Year to TabName" = Table.AddColumn(#"Changed Type2", "TabNameWithYear", each [TabName] & " " & Text.Middle([Worksheet], Text.PositionOf([Worksheet], "20"), 4), type text),

    // Drop the old TabName (without year) and rename the new one in its place
    #"Removed Old TabName" = Table.RemoveColumns(#"Added Year to TabName",{"TabName"}),
    #"Renamed Final" = Table.RenameColumns(#"Removed Old TabName",{{"TabNameWithYear", "TabName"}}),

    // Put columns in the final desired order
    #"Reordered Columns" = Table.ReorderColumns(#"Renamed Final",{"Worksheet", "TabName", "Type", "ID", "Created", "Description", "Amount", "Currency", "Converted Amount", "Fees", "Net", "Converted Currency", "Details", "Customer ID", "Customer Email", "rs_document (metadata)", "rs_component (metadata)", "rs_signer_name (metadata)", "rs_signer_email (metadata)", "card_last4 (metadata)", "Memo / Notes"}),

    // Final cleanup: drop any completely blank/null-type rows
    #"Filtered Rows1" = Table.SelectRows(#"Reordered Columns", each [Type] <> null)
in
    #"Filtered Rows1";
Transform Data for QB: filtered QuickBooks export
shared #"Transform Data for QB" = let
    // Pull the "Data" query's output from within this same workbook
    Source = Excel.CurrentWorkbook(){[Name="Data"]}[Content],

    // Set data types across all columns
    #"Changed Type" = Table.TransformColumnTypes(Source,{{"Fees-Date", type datetime}, {"Worksheet", type text}, {"TabName", type text}, {"Type", type text}, {"ID", type text}, {"Created", type datetime}, {"Description", type text}, {"Amount", type number}, {"Currency", type text}, {"Column1", type number}, {"Converted Amount", type number}, {"Fees", type number}, {"Net", type number}, {"Converted Currency", type text}, {"Details", type text}, {"Customer ID", type text}, {"Customer Email", type text}, {"rs_document (metadata)", type text}, {"rs_component (metadata)", type text}, {"rs_signer_name (metadata)", type any}, {"rs_signer_email (metadata)", type any}, {"card_last4 (metadata)", type any}, {"Memo / Notes", type text}}),

    // Keep only rows where the transaction Type is "Charge"
    #"Filtered Rows" = Table.SelectRows(#"Changed Type", each ([Type] = "Charge")),

    // Remove metadata/columns not relevant for the QuickBooks export
    #"Removed Columns" = Table.RemoveColumns(#"Filtered Rows",{"rs_component (metadata)", "rs_signer_name (metadata)", "rs_signer_email (metadata)", "Converted Currency", "Column1", "Currency"}),

    // Simplify "Created" from datetime down to just date
    #"Changed Type1" = Table.TransformColumnTypes(#"Removed Columns",{{"Created", type date}}),

    // Drop remaining columns not needed for the final QB export
    #"Removed Columns1" = Table.RemoveColumns(#"Changed Type1",{"Fees-Date", "card_last4 (metadata)", "Memo / Notes"})
in
    #"Removed Columns1";
Allocation logic (reconstructed, generic column names)
Allocation % = [Charge Amount] / SUMIFS([Charge Amount], [Charge Date], [@Charge Date])
Allocated Fee = [Allocation %] * XLOOKUP([@Charge Date], DailyFees[Date], DailyFees[Total Fee])
The public version contains the custom allocation logic and the principal Power Query transformations while omitting the boilerplate queries automatically generated by the standard "Combine Files" workflow.
09Disclosure
This case study is based on production work supporting the accounting function of a business processing a high volume of Stripe transactions.
The public workbook has been independently reconstructed using synthetic data. Company names, customer information, transaction values, dates, and internal identifiers have been removed or replaced.
Some features from the original workbook (including CRM deal matching) have been omitted to protect confidential business processes while preserving the allocation methodology, reconciliation framework, and overall system architecture.