Yearly Sales Forecasting & Scenario Analysis
Full custom sales forecast model that converts historical CRM bookings/sales into a range of year-end outcomes and a practical assessment of whether the annual objective remains achievable.
- Problem
- Leadership needed to know, at any point in the year, whether the annual sales objective was still achievable given the historical booking curve.
- What I Built
- A rolling forecast model that converts 105 weeks of historical CRM booking activity into probability-based revenue scenarios.
- Impact
- The central-case scenario projected a $1.76M gap to the $25.75M objective with 22 weeks remaining, flagging the target as not reachable at the required pace.
- Stack
- ExcelStructured TablesDynamic ArraysForecast Modeling
Project Summary
- Role
- Sales Forecasting & Decision Support Analyst
- Sector
- Sales Forecasting & Decision Support (Travel)
- Project Type
- Excel forecasting and reachability assessment model, refreshed biweekly from CRM exports
- Tools
- Power Query (data ETL), Structured Tables, named ranges, forecasting techniques
- Input
- CRM booking history, current-week sales-to-date
- Output
- Year-end forecast range, reachability verdict
105
Booking windows per fiscal year
52 pre-year + 53 in-year
$10K–$400K
Deal size range
Biweekly
Refresh cadence
Impact
- Replaced a static, prior-year-plus-growth-rate estimate with a range-based forecast tied to actual booking pace.
- Determined pacing gaps from objectives no longer supported by the year's historical performance.
- Delivered a standing biweekly reachability verdict, comparing the pace still required against the strongest comparable historical period.
2026 Reachability Verdict
NOT REACHABLE
Central case forecast output is $23,994,733 against a $25,750,000 objective. We have a $1,755,267 gap with 22 weeks remaining.
Decision Context
For this business model, the sales cycle spans two years.
Each fiscal year remains on sale across a 105-week window: 52 weeks before the fiscal year begins and 53 weeks within the year itself. Therefore two sales years remain active in the market at the same time (current year & next year).
Individual opportunities range from approximately $10K to $400K, so a small number of deals can materially affect weekly performance. The prior forecast method started with the prior year's result and applied an expected growth rate. It provided a planning target, but it did not show whether the current booking pace still supported that outcome.
The Problem
Management needed to know where the year was likely to finish based on sales already booked, and whether the remaining objective required a realistic level of performance.
Existing situation
Required outcome
Static estimate: prior year plus an expected growth rate.
Range-based forecast tied to actual booking pace.
No link between current pace, seasonality, and time remaining.
Reachability verdict comparing the required pace to the best historical period.
As a result, the existing approach could not distinguish between a temporary pacing gap and an objective that was no longer supported by historical performance.
Model Architecture
The workflow has five stages, from a biweekly CRM refresh through to the sales review.
01
CRM Export
Opportunity-level CRM data is refreshed every two weeks.
02
Week-Coding / ETL
Each closed-won deal is assigned to its relative position in the 105-week sales window and the fiscal year it belongs to.
03
Historical Sales Engine
Weekly and cumulative sales matrices update, and the historical booking curves recalculate.
04
Forecast + Reachability Assessment
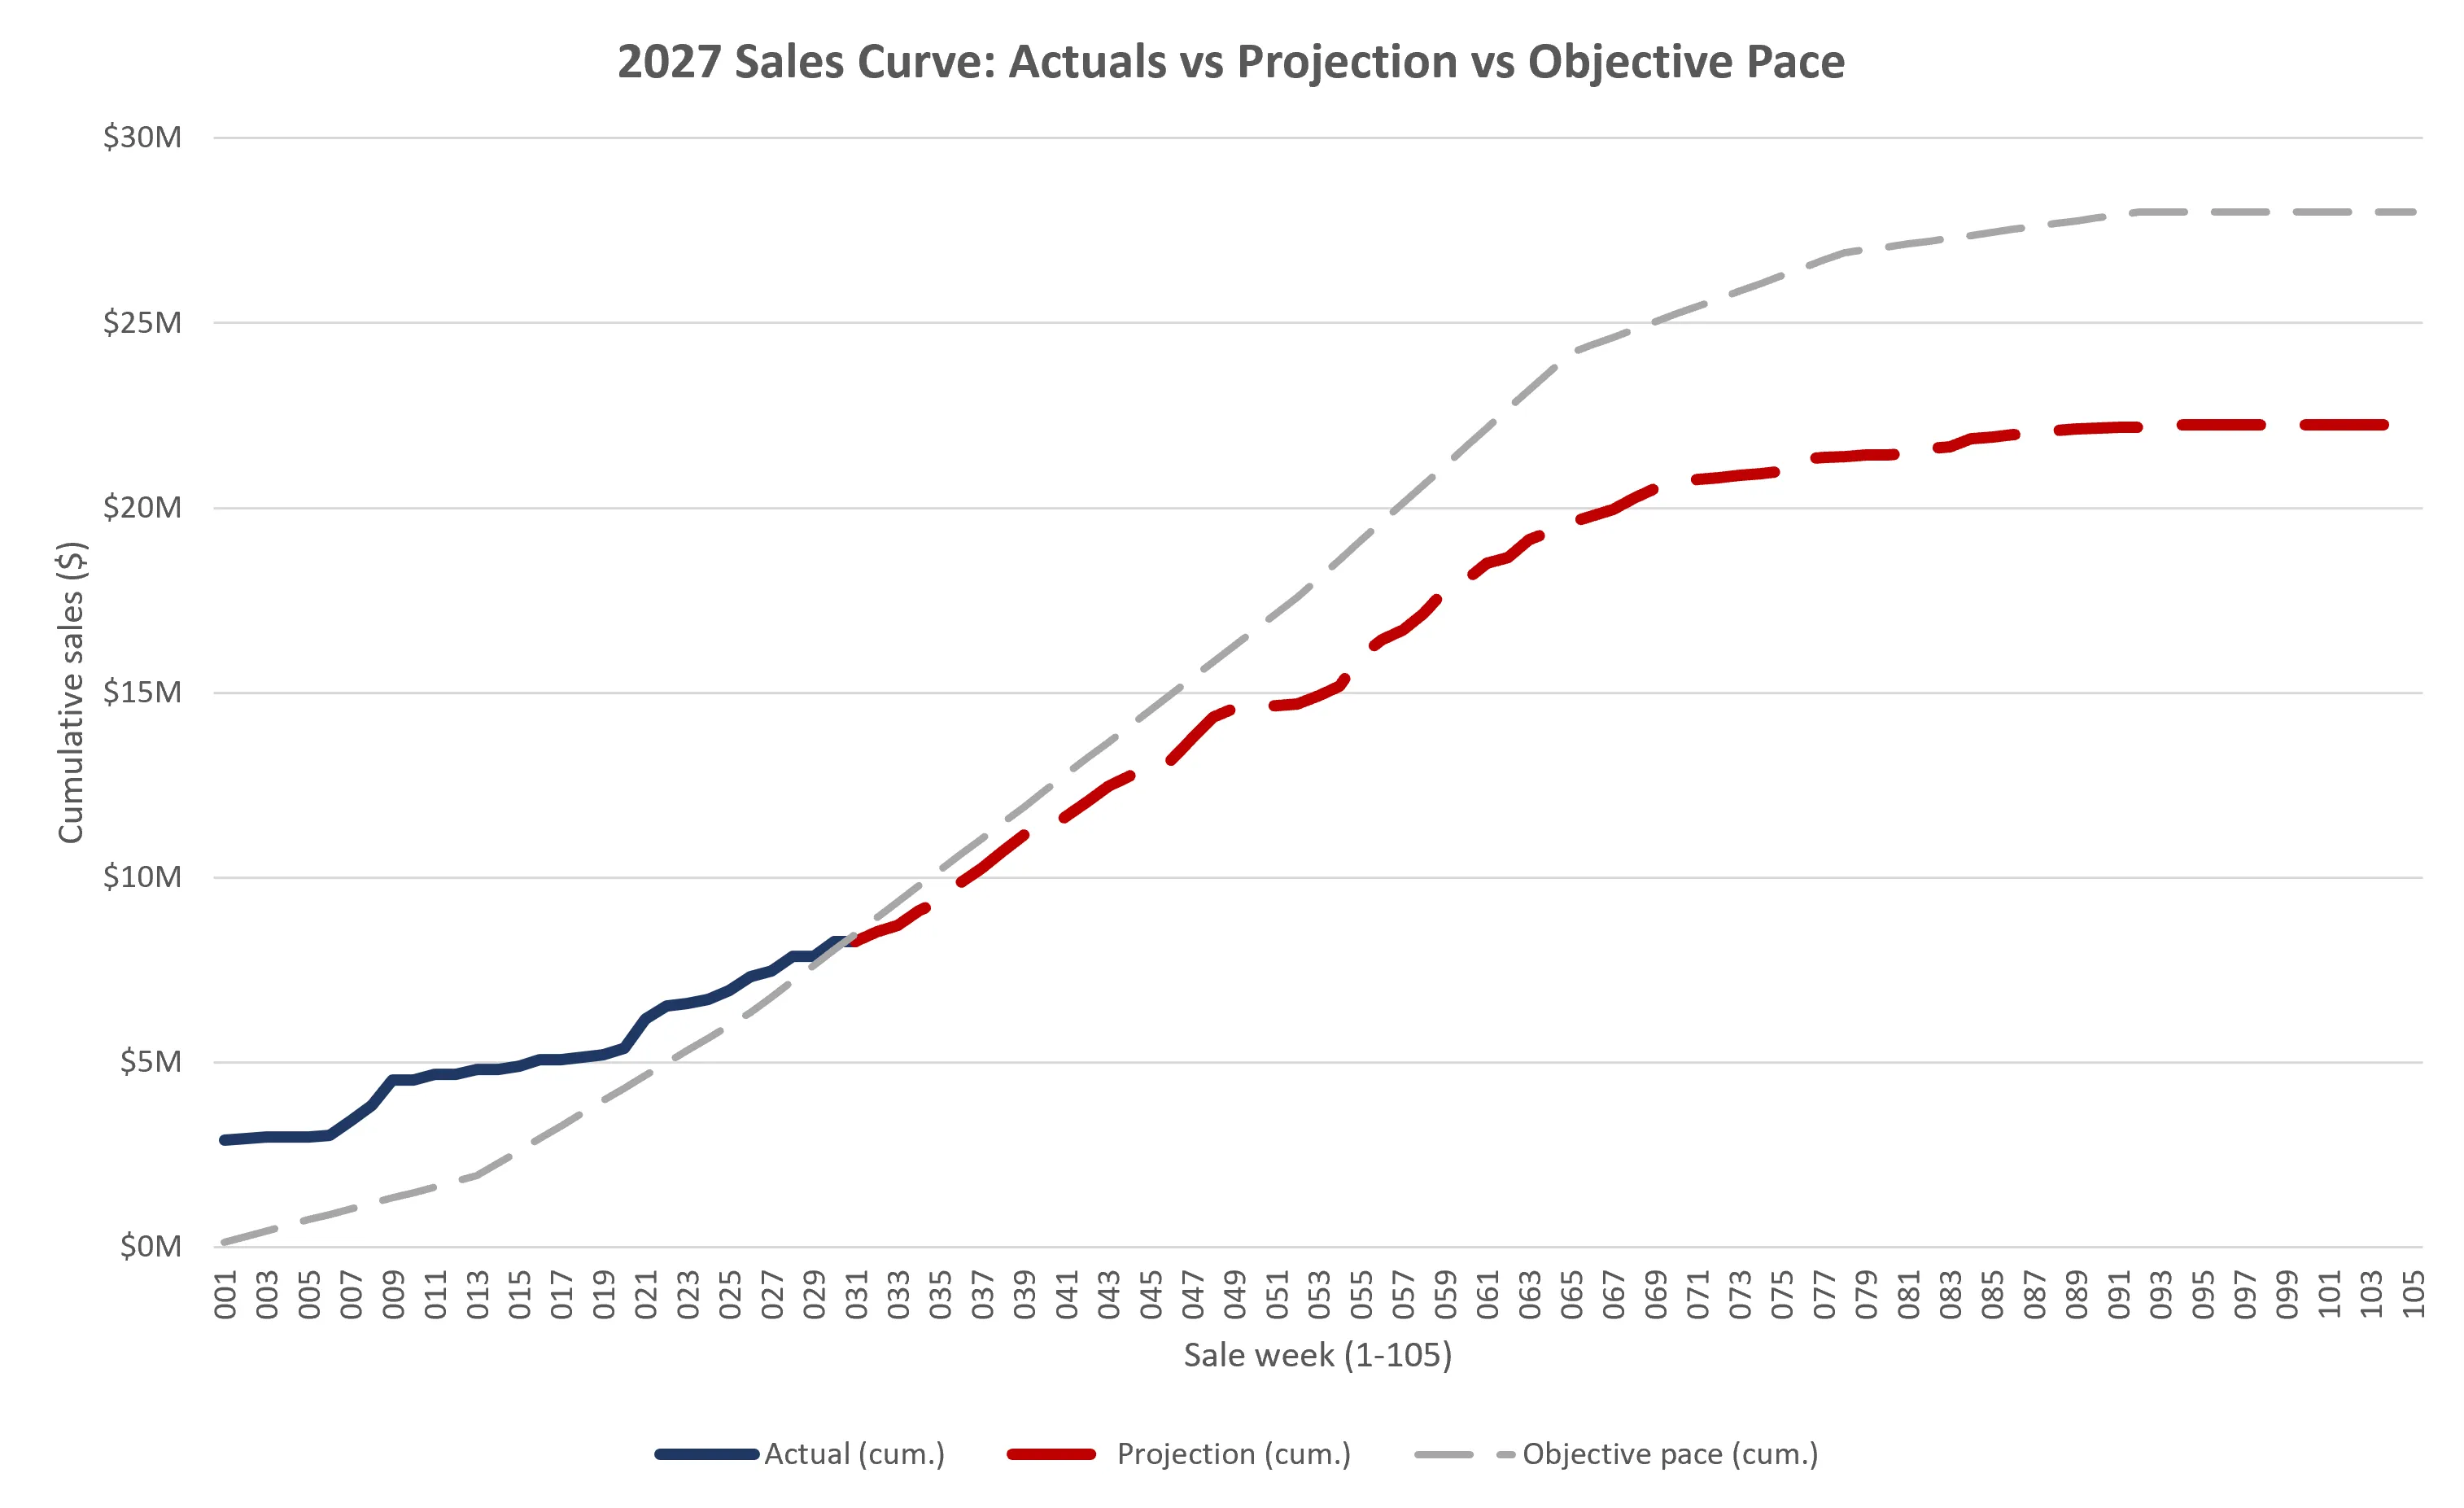
The model produces a year-end forecast range, a reachability verdict, and the pacing chart used in the review.
05
Biweekly Sales & Marketing Review
The forecast range and verdict are brought to the recurring sales meeting for discussion and action.
My role covered the complete process: CRM refresh, transformation logic, forecasting methodology, workbook controls, and preparation of the core outputs for the biweekly meeting.
Methodology
Two complementary forecasting methods.
Historical completion curves
For each historical year, the model calculates what percentage of final sales had already been booked by the equivalent week. That completion percentage is applied to the current year's sold-to-date figure across five comparison sets: pre-COVID years, the latest three years, the previous year, and the fastest and slowest historical curves. The result is a forecast range rather than a single-point estimate.
Seasonality-weighted projection
The central year-end estimate is distributed across the remaining weeks using the historical weekly sales pattern from the latest three comparable years. This keeps the projected curve aligned with observed seasonality rather than drawing a straight line from the current position to the forecast endpoint.
Selected Work: Reachability Assessment
The forecast range estimates where the year may finish. The reachability assessment addresses the more immediate management question: does the remaining objective require a weekly sales rate the business has achieved before in a comparable period?
2026 · sold $23,333,696 at week 83 of 105 · objective $25,750,000
| Scenario | Curve % complete | Year-end forecast | vs. Objective |
|---|---|---|---|
| High (slowest curve) | 92.4% | $25,260,824 | −$489,176 |
| Pre-COVID baseline | 94.7% | $24,638,776 | −$1,111,224 |
| Last year (2025) | 95.2% | $24,505,585 | −$1,244,415 |
| Central case (recent 3yr) | 97.2% | $23,994,733 | −$1,755,267 |
| Low (fastest curve) | 98.4% | $23,723,100 | −$2,026,900 |
Reachability Verdict
NOT REACHABLE
Reaching the objective would require average sales of$109,832 per week over the remaining 22 weeks. The strongest comparable non-COVID period averaged$30,303 per week. The required pace is therefore3.6 times the best historical benchmark. Open pipeline represents approximately 18% of the remaining gap and is not sufficient to change the assessment.
Interactive Demonstration
The public demonstration below recreates the core forecasting logic using fabricated data: a toggleable sales curve for two on-sale travel years, and a standalone reachability calculator you can test with your own sold-to-date, week, and objective figures.
This is a portfolio extension: the production model's interactivity lives inside Excel's financial model.
Download Sample Excel Workbook08Outcome
Developed a range-based forecasting model across a rolling 105-week sales window, supported by a separate assessment of whether the annual objective remained achievable.
Replaced a static annual estimate with a repeatable biweekly process: refresh CRM data, update the model, review the forecast range, and assess the remaining target.
Made the gap between current performance and the annual objective explicit. When booking pace diverged materially from plan, the model supported earlier discussion and adjustment of expectations.
Introduced structured references, centralized controls, reconciliation checks, and method validation. Forecasting approaches that produced biased or unrepresentative results were removed rather than retained as additional complexity.
09Technical Notes
Designed for repeatable refreshes.
- Structured Excel Table references are used instead of fixed cell ranges, allowing source tables and model sections to expand without breaking lookup logic. The model was migrated to this structure after an earlier sheet redesign exposed the fragility of fixed-range formulas.
- Named ranges such as Today, TWeek2026, and Sales_Obj26 centralize the principal control inputs.
- Reconciliation checks confirm that each projected sales curve reaches its corresponding year-end forecast at week 105.
10Disclosure
This case study is based on production work supporting the sales forecasting function of a business selling on a multi-year advance booking cycle.
The company name, financial figures, and opportunity-level records used in this case study and its companion interactive demonstration are fictional. The modeling approach, workbook structure, and formulas reproduce the original work in anonymized and synthetic form. "Solstice Travel Co." is a placeholder and does not identify an actual client.